

ID Theory Insights
ID Theory is a London-based cryptoasset investment firm. Our weekly Insights report provides the latest key macro as well as on-chain data for Bitcoin. If you would like to receive insights directly to your inbox, you can subscribe here.
BTC and Gold
Gold has served as a safe haven asset for 1000’s of years. Any positive correlation may indicate BTC beginning to earn safe haven status.

BTC and Inverted US 2 Year Treasury Yield
In a risk-off environment Treasury yields drop. Positive correlation here points to BTC being considered a risk-off asset.

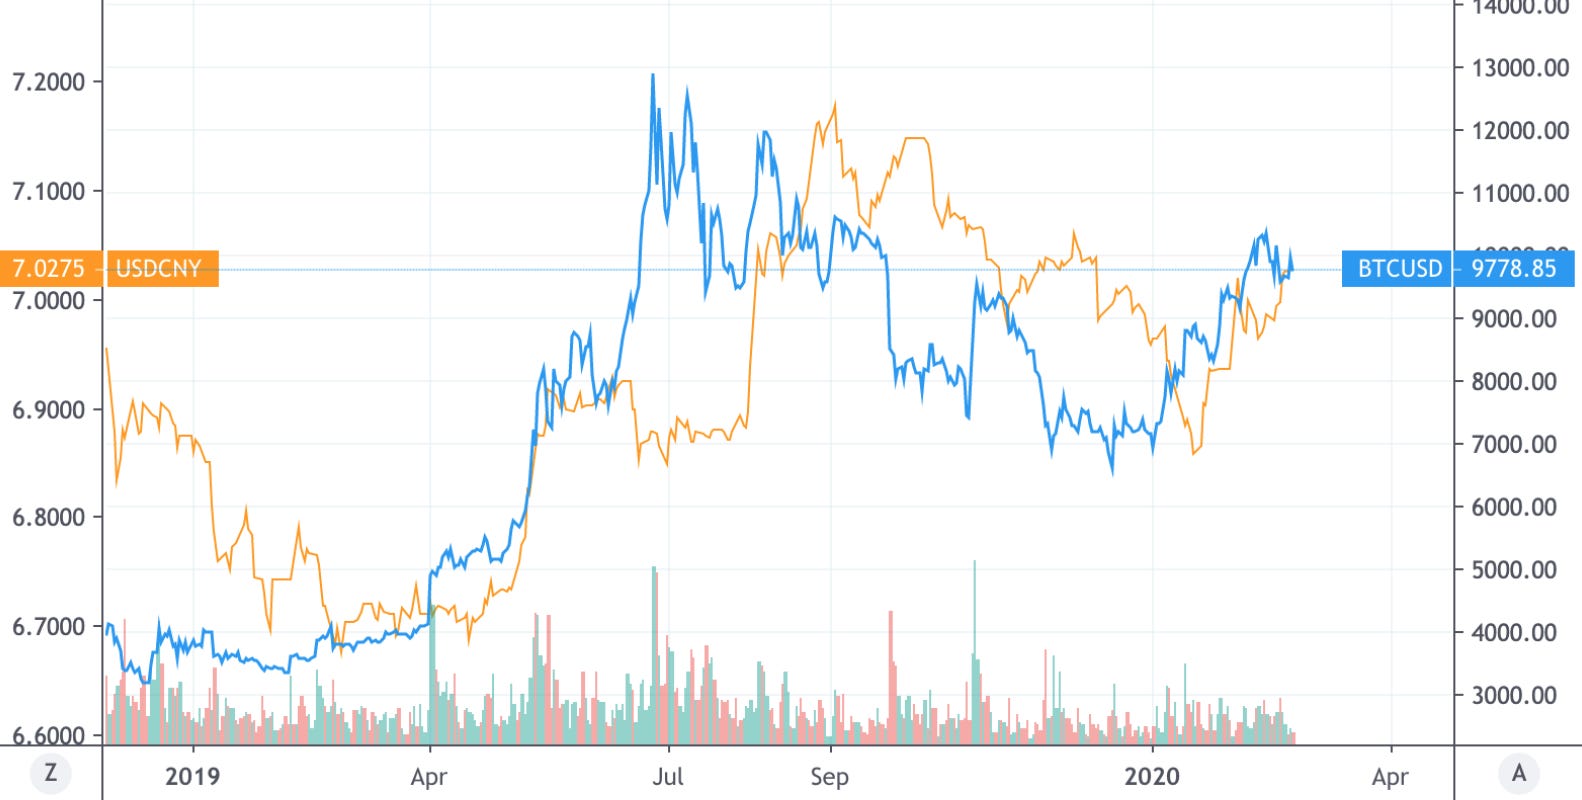
BTC and USD/CNY
Weakening CNY may lead to a greater demand for capital flight from China. Positive correlation here may indicate BTC is being used as a mechanism for this flow.
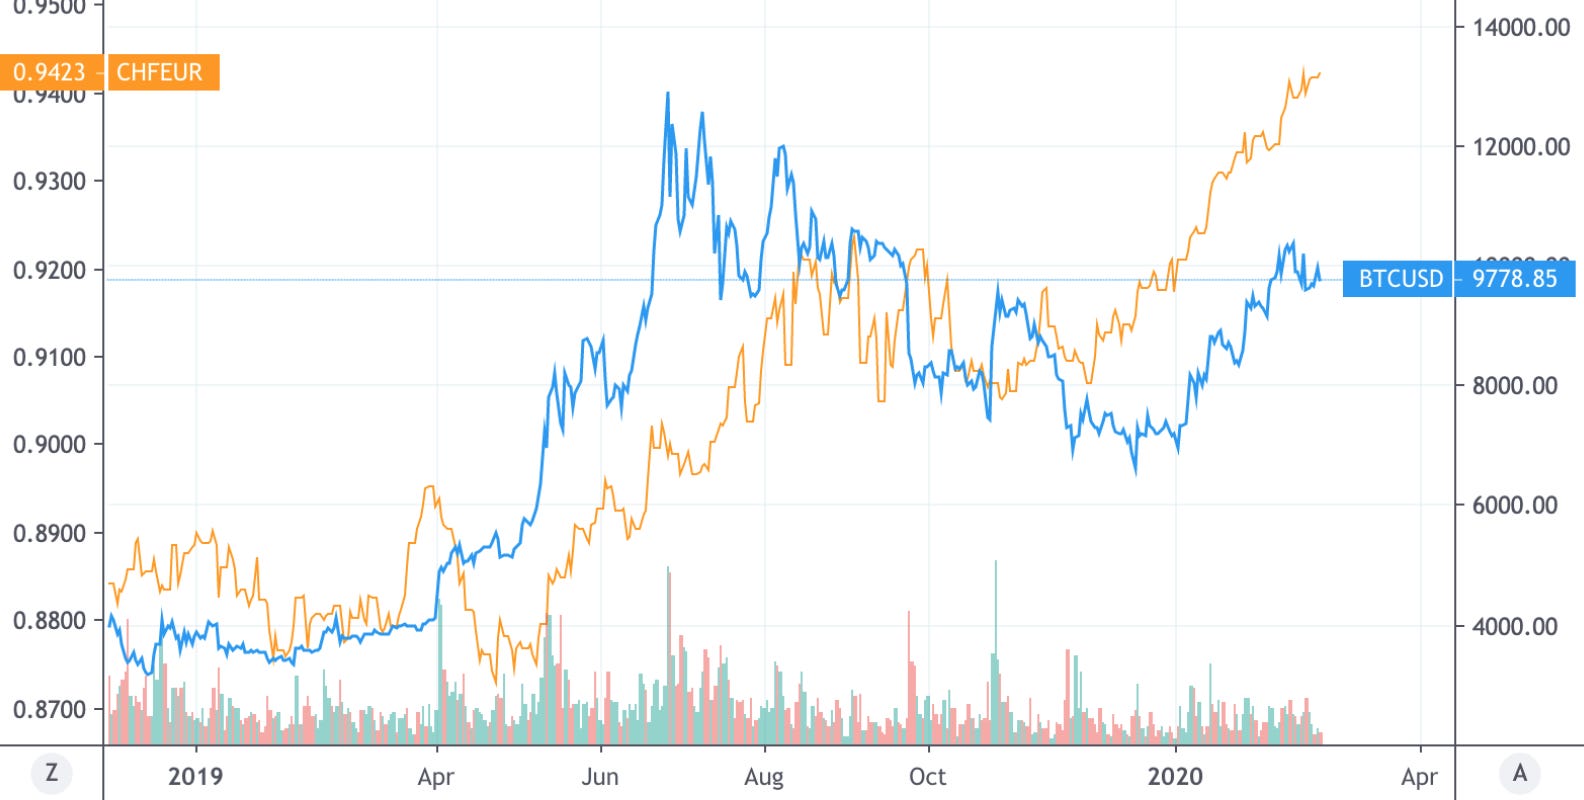
BTC and CHF/EUR
The Swiss Franc (CHF) is a safe haven currency. If there is correlation between CHF strengthening against EUR, this may indicate BTC being utilised as a risk-off asset.
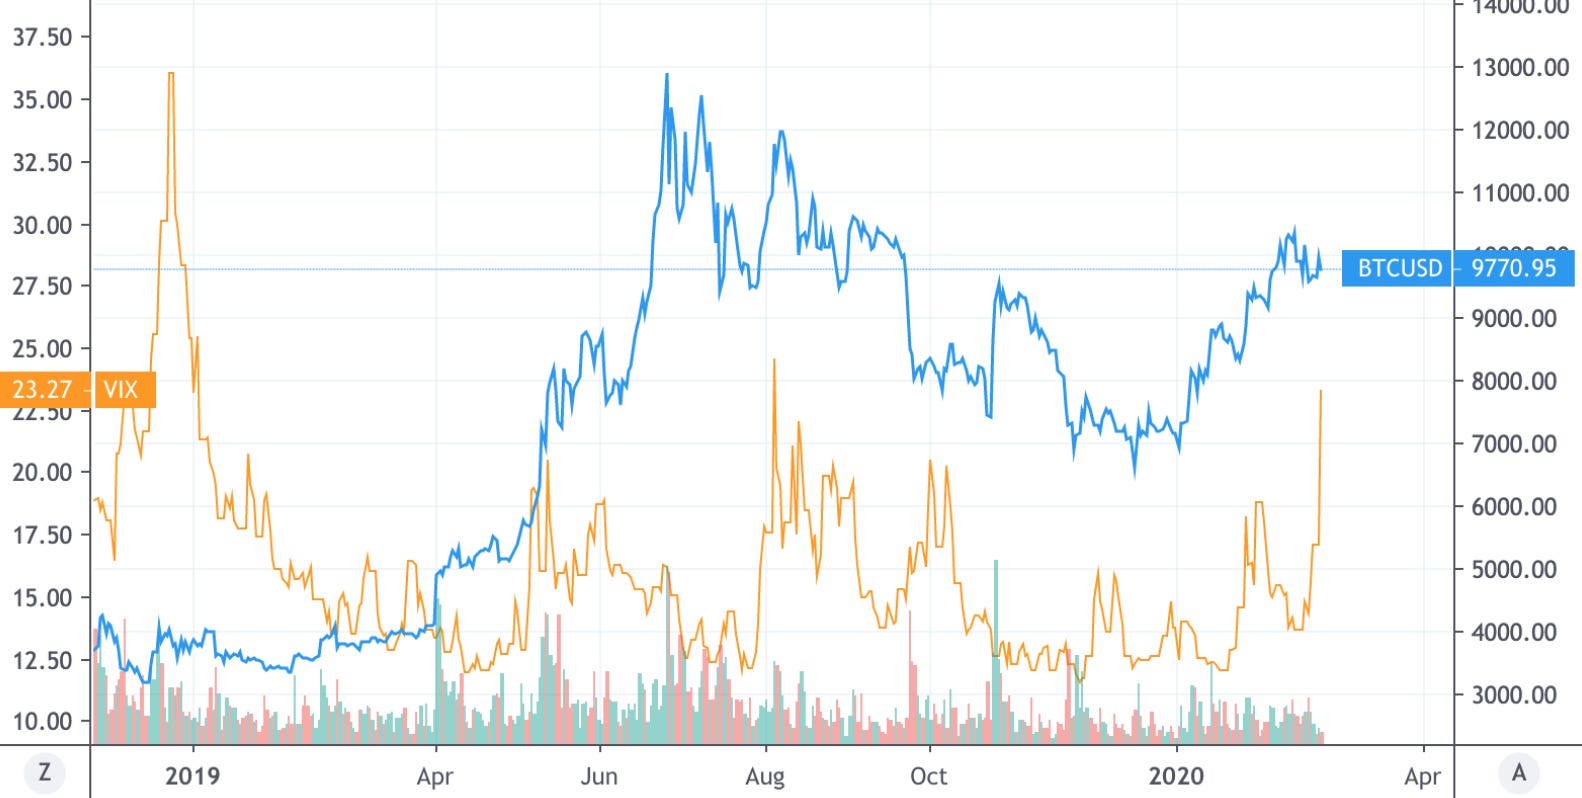
BTC and VIX
Volatility (represented by the VIX) generally increases in times of economic uncertainty. Strong correlation between the VIX and BTC may indicate it be utilised as a risk-off asset.
BTC and SMAs
Simple moving averages (SMA’s) smooth price histories by averaging daily prices over a given period of time. Crossing moving averages represent a shift in momentum.
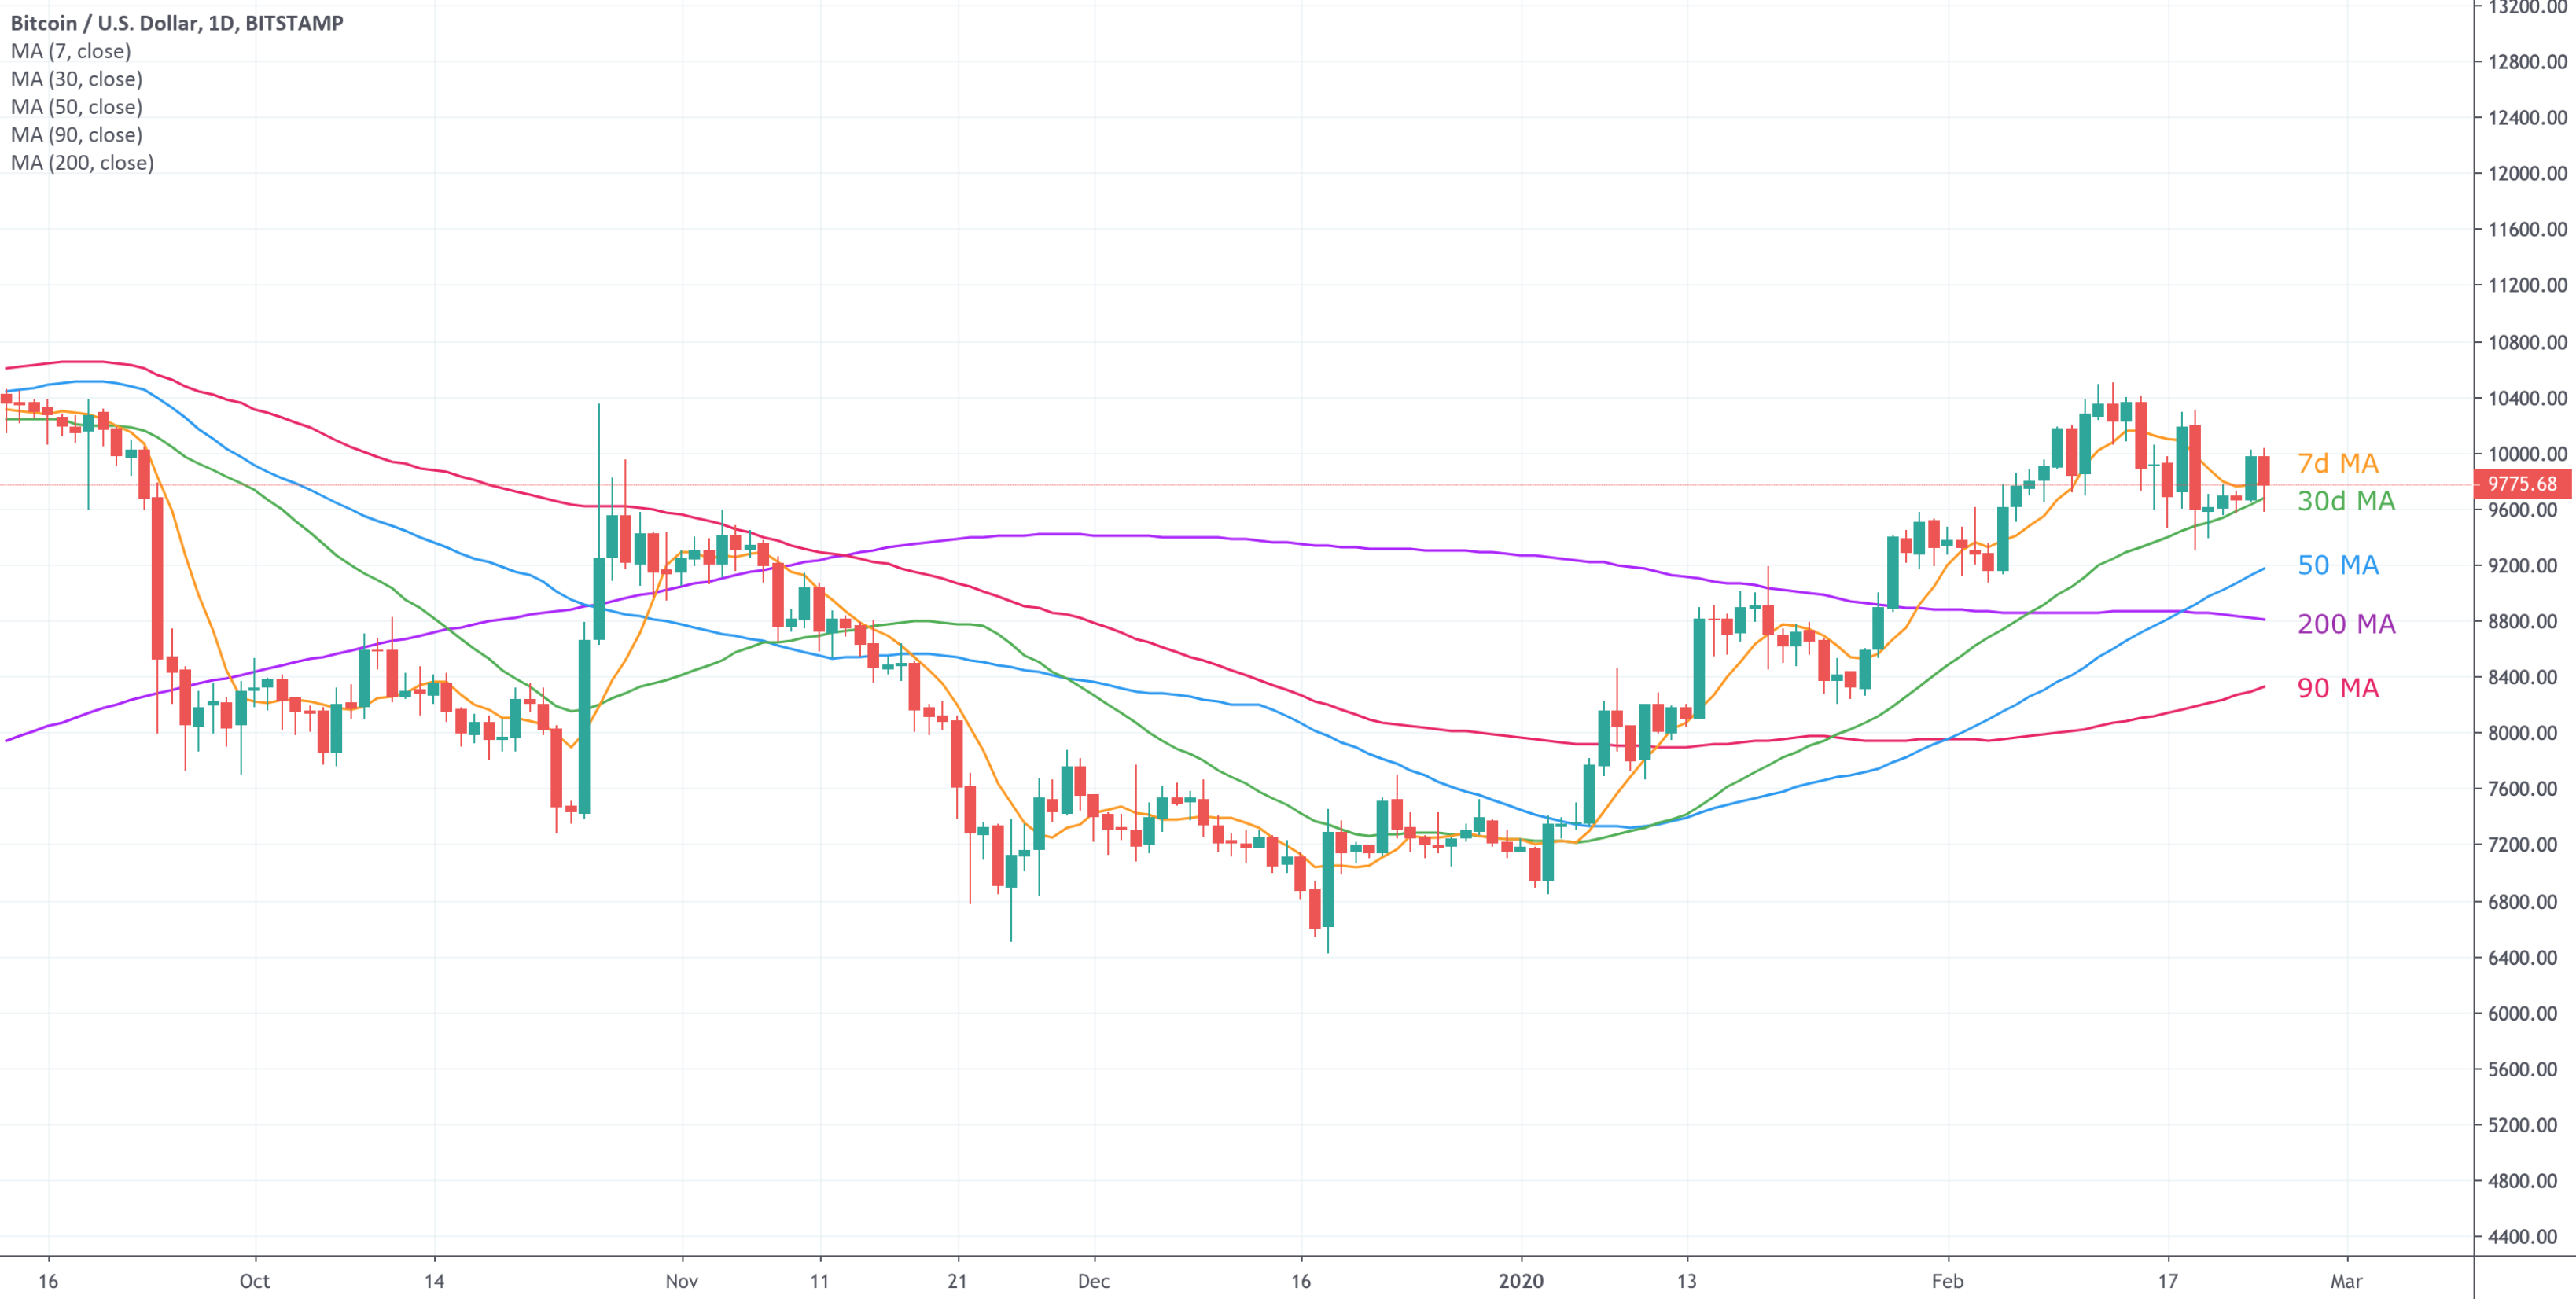
Despite BTC’s 50-day moving average crossing above its 200-day moving average on the 18th February (Golden Cross), Bitcoin fell nearly 10% on the 19th February before recovering some of its losses. This chimes with a very similar move that occurred when the same moving averages crossed in April 2019.
April 2019

BTC and MACD
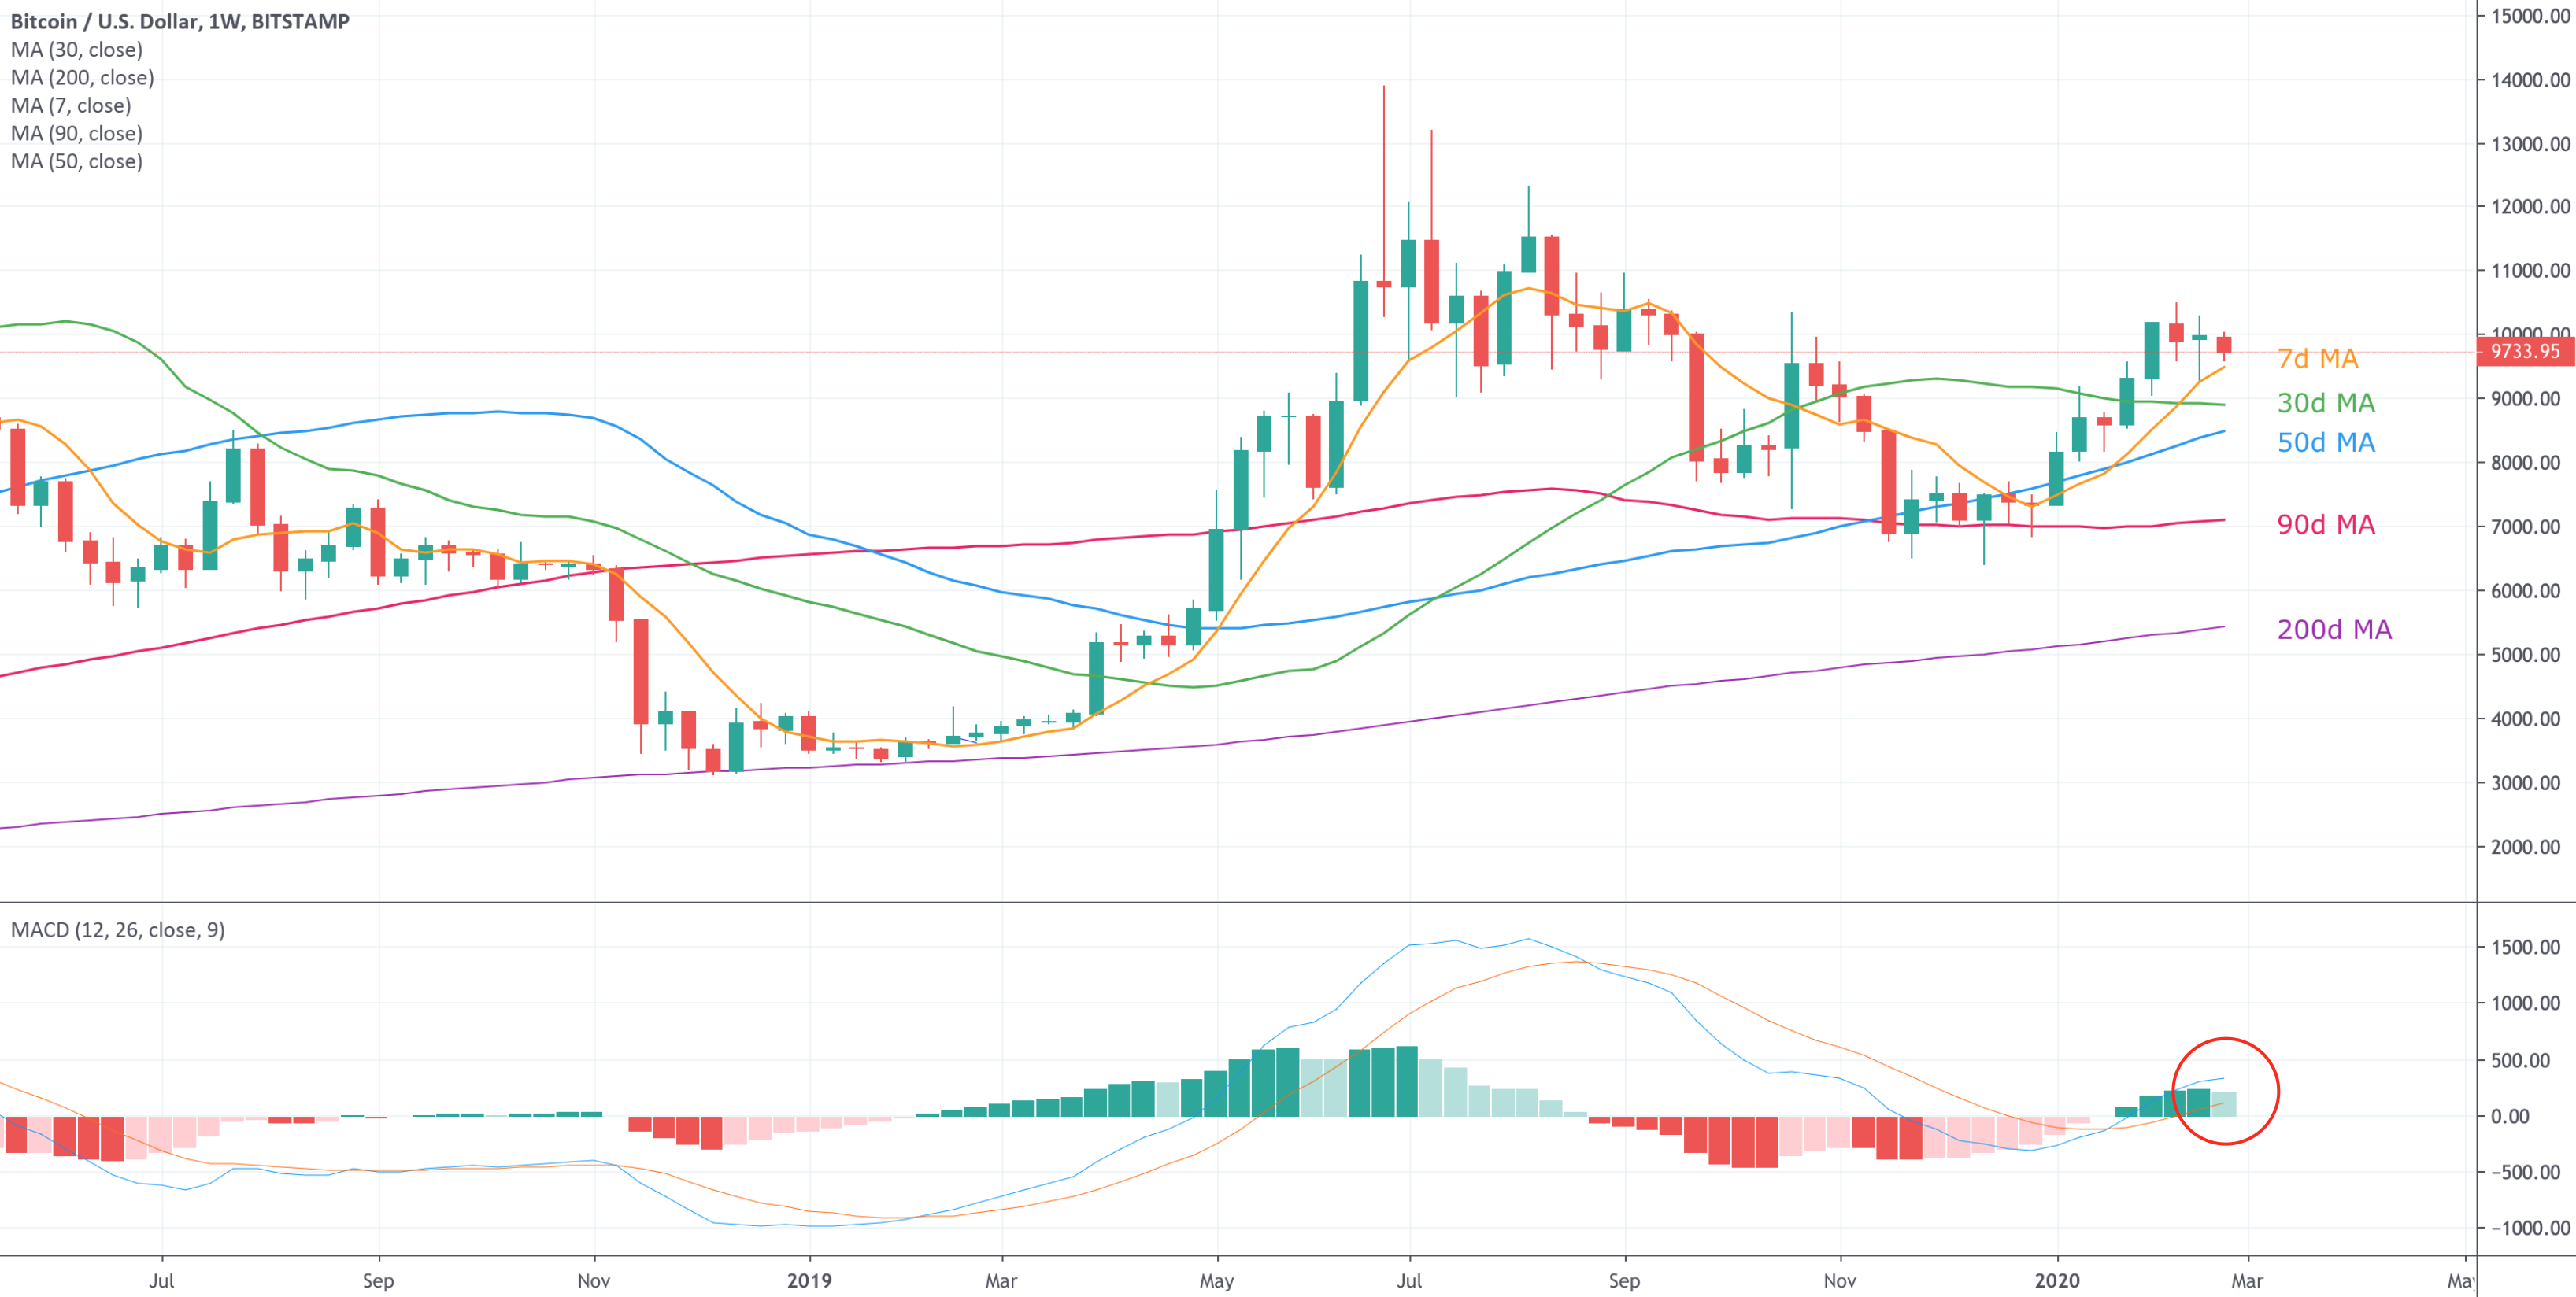
Bullish momentum on the weekly MACD has slowed this week for the first time since the MACD turned bullish on 27th January.
Bitcoin Price Action
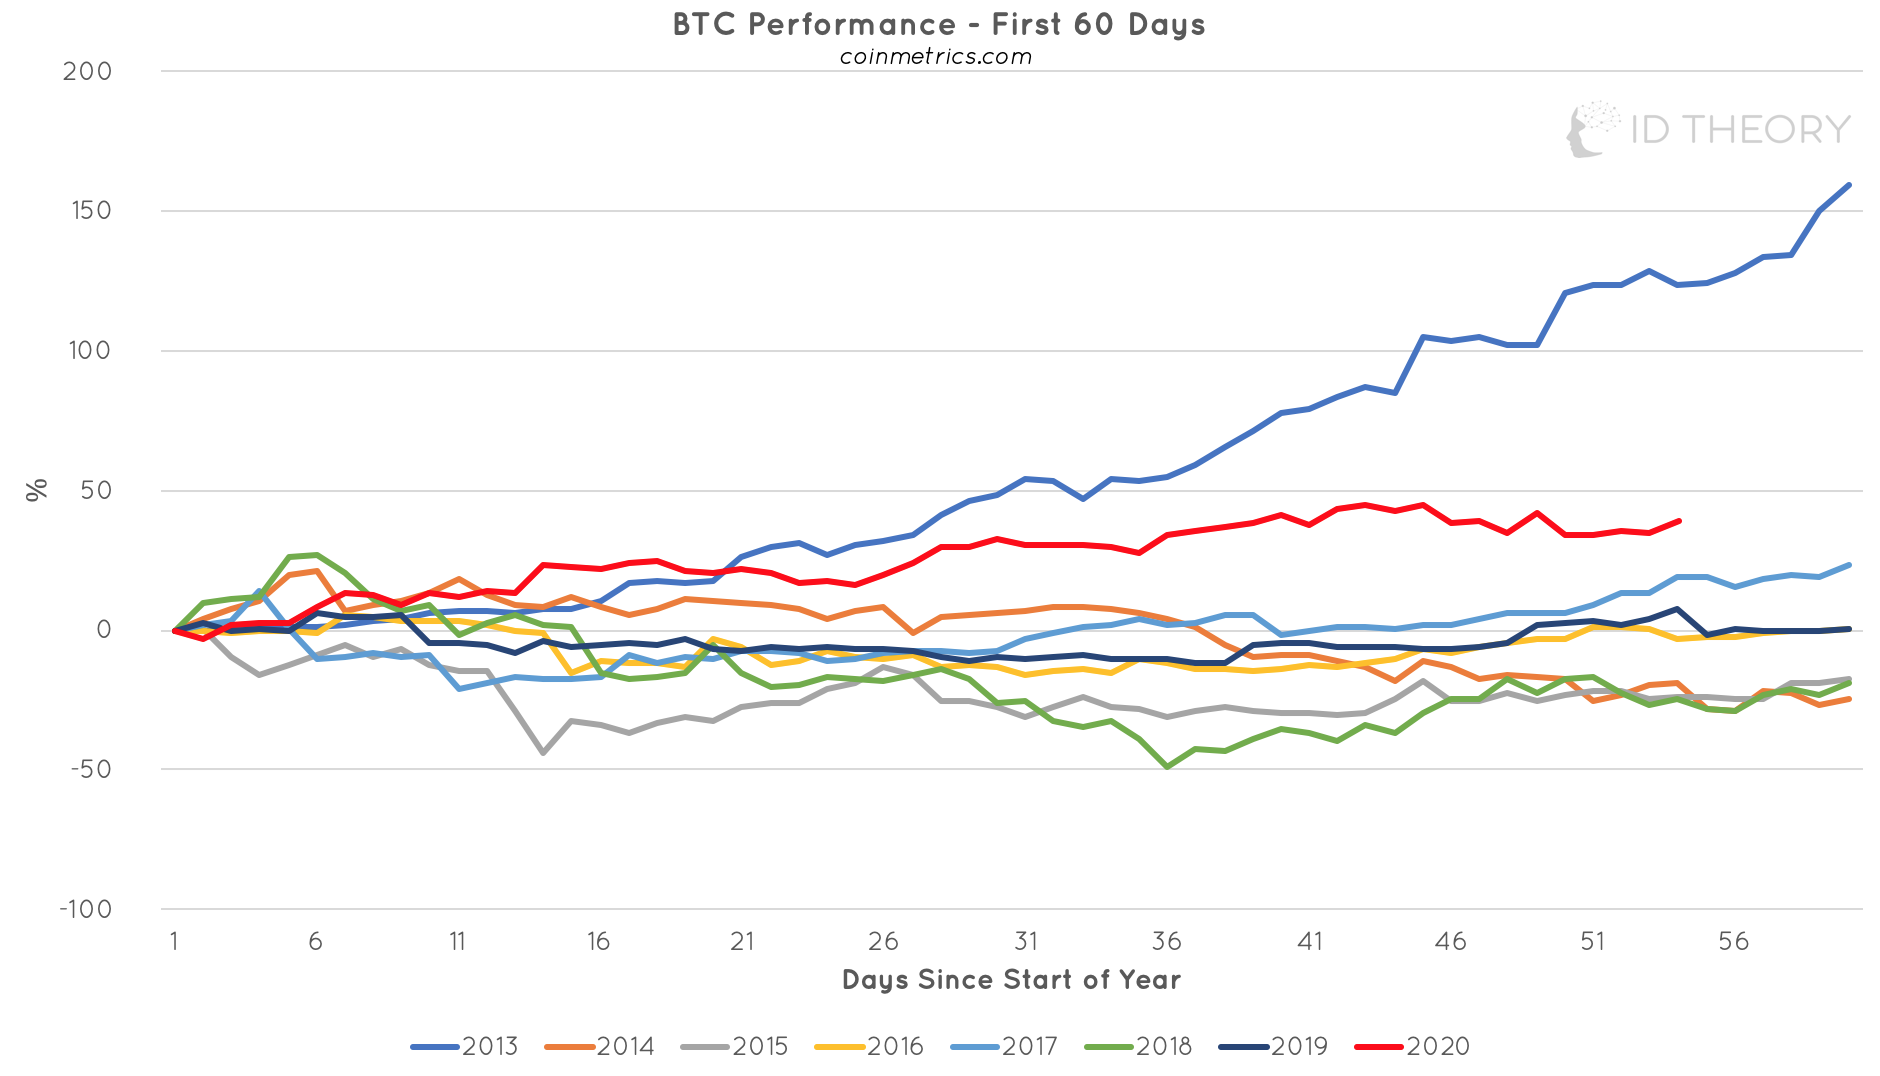
2020 is still the best performing year for BTC since 2013 with price up 39% YTD.
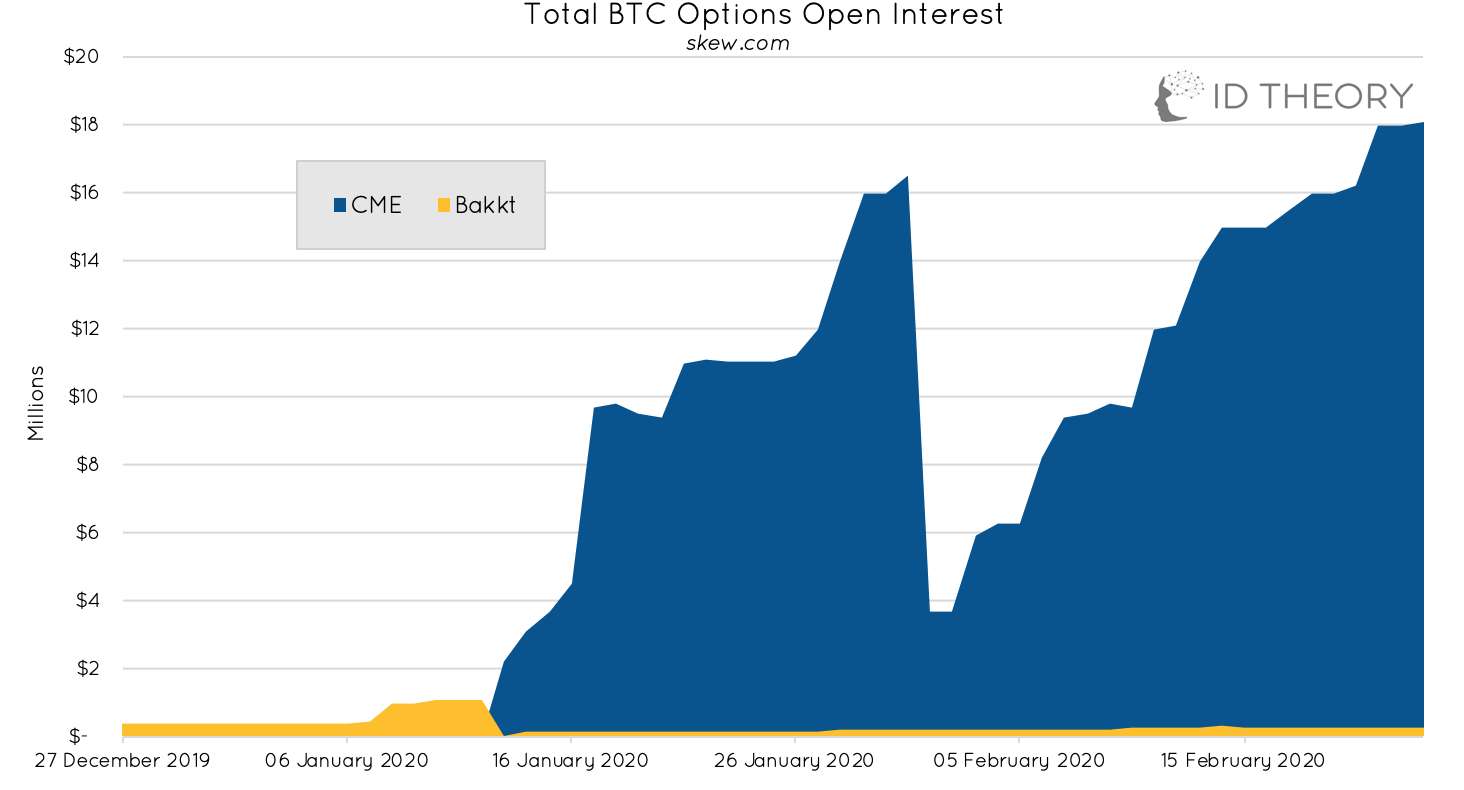
Bitcoin Derivative Market
The Commitment of Traders (COT) is a weekly report issued by the CFTC enumerating the holdings of participants in the Futures market. Dealer/Intermediary represents the sell side, Asset Manager/Institutional represents the buy-side.
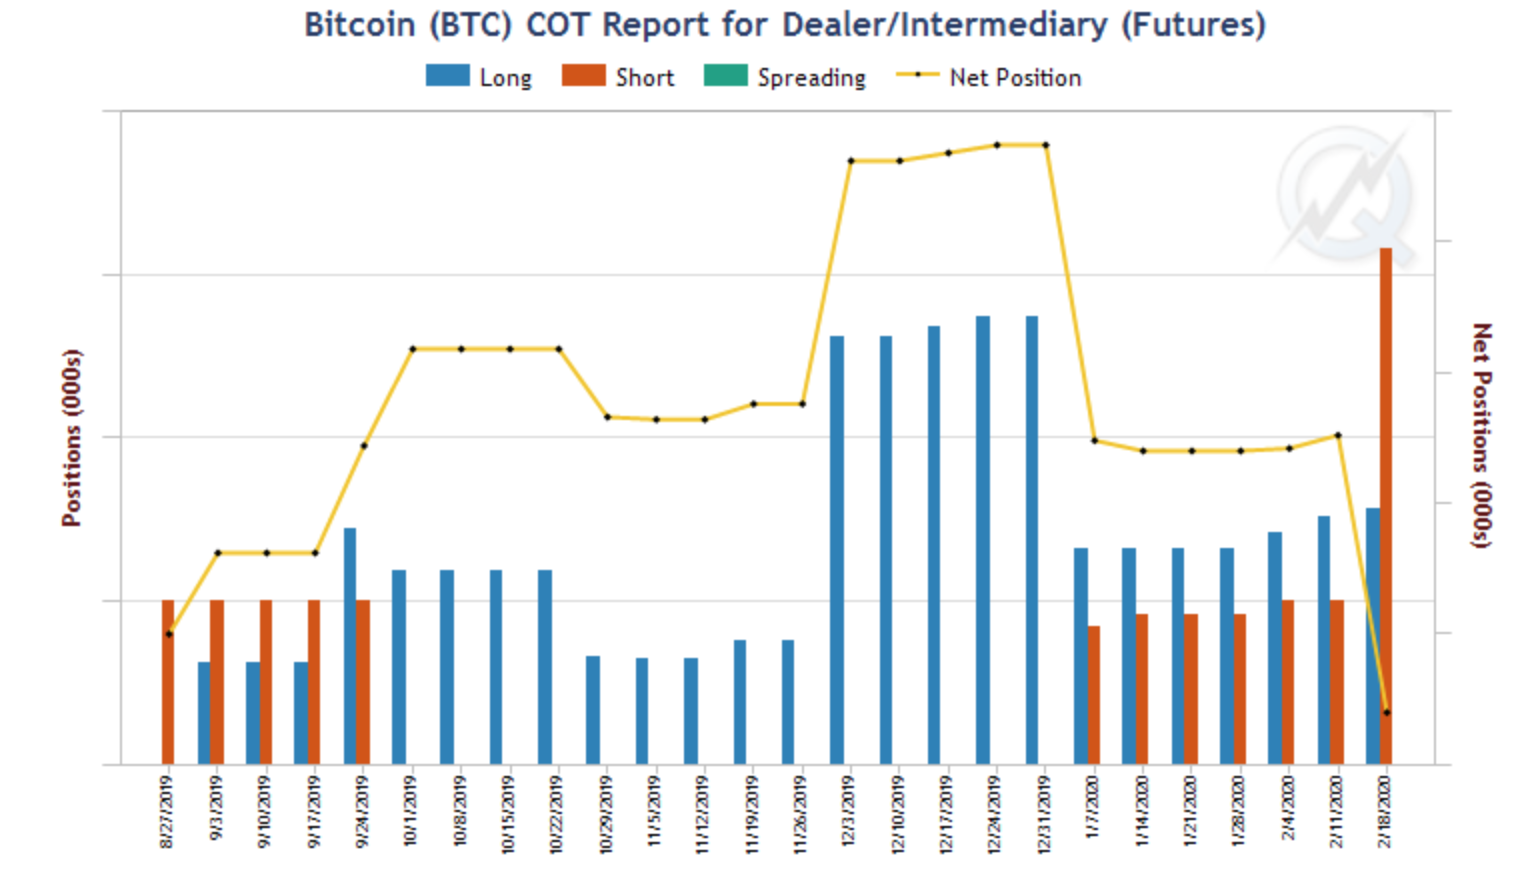

There has been a sharp increase in the number of short positions by dealer/intermediaries. Asset managers have reduced their long positions and increased their short positions.
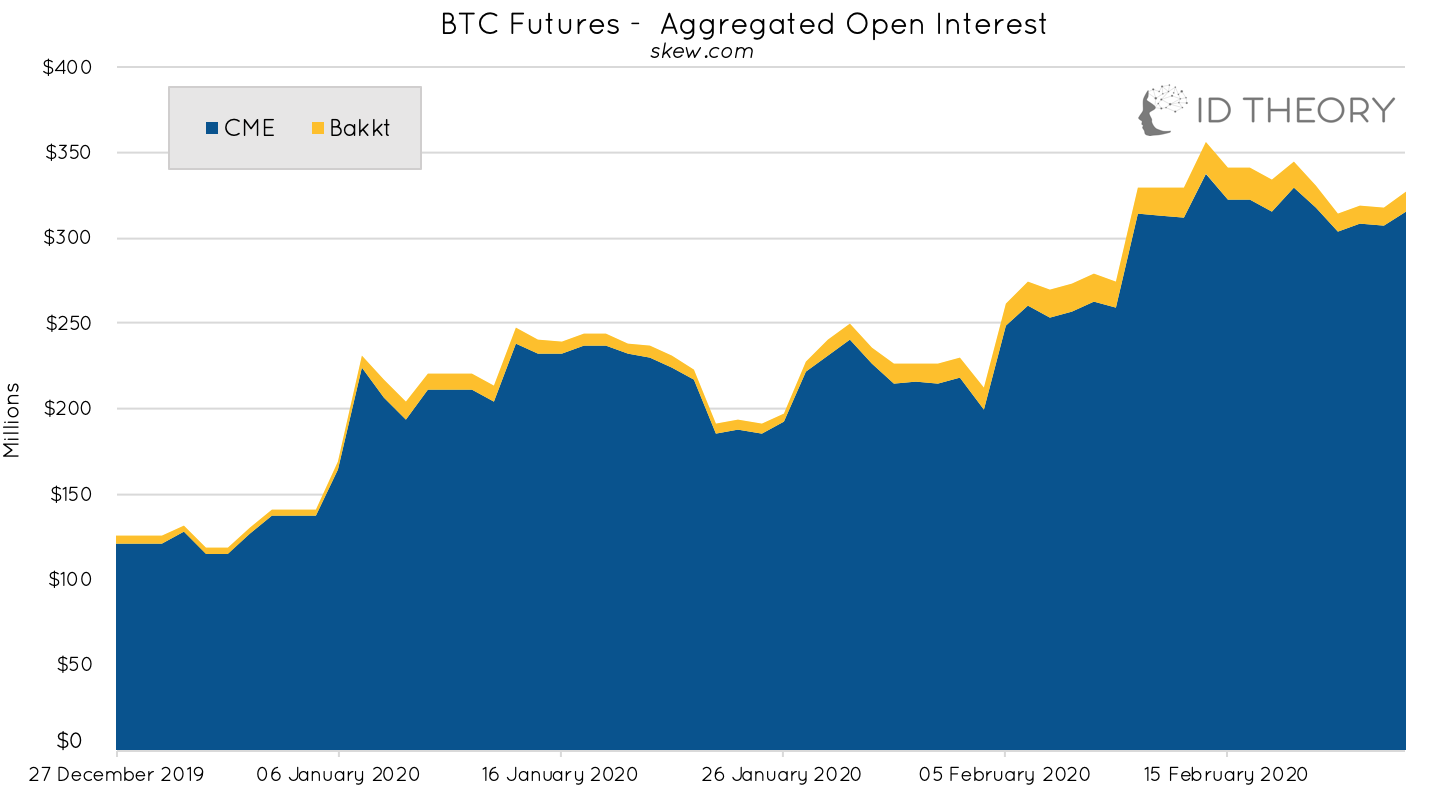
Open interest shows the USD value of open contracts offered by various platforms.
Fundamentals
Google Trends - ‘Bitcoin’
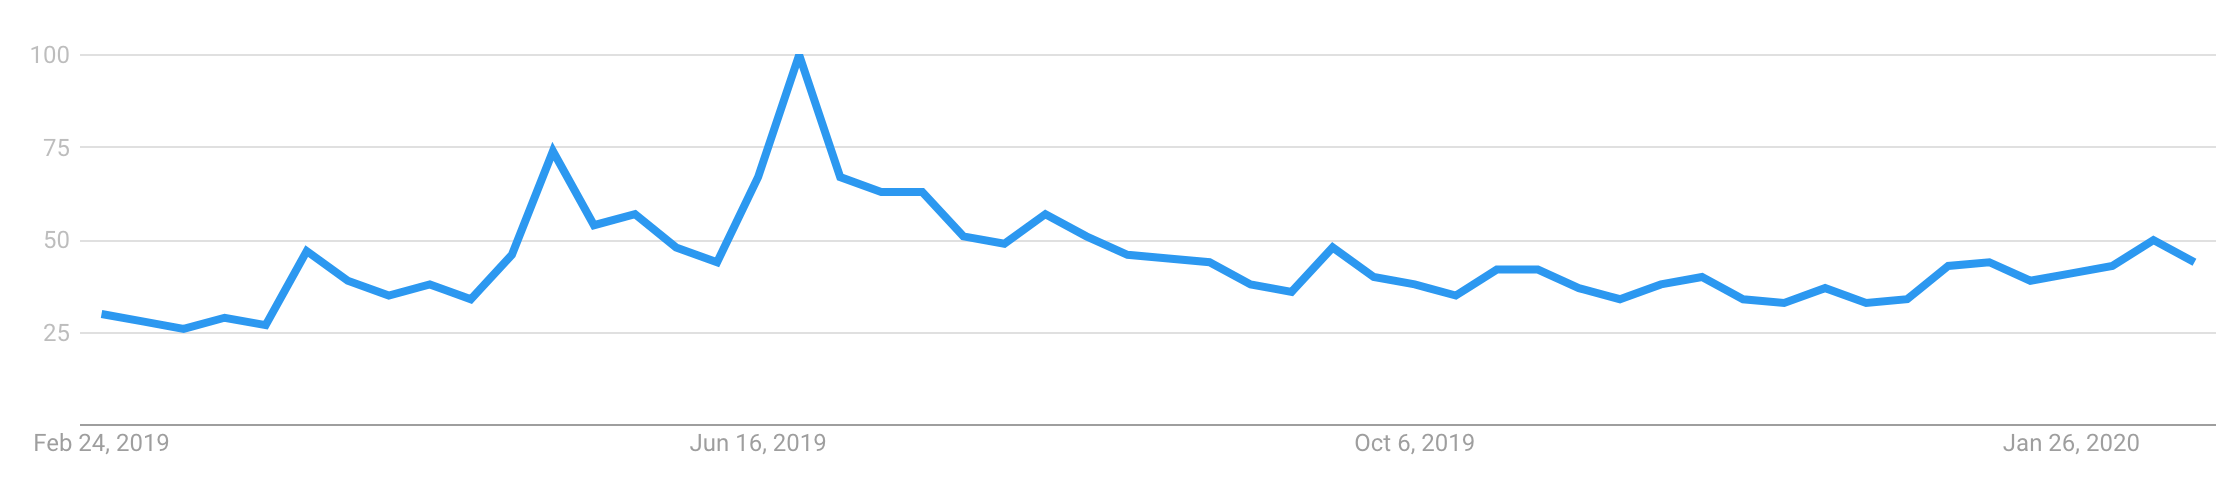
Worldwide Google searches for ‘Bitcoin’ continues to climb on the index since the start of 2020 but is currently still lower than searches seen during the Bitcoin bull run seen in summer 2019.
Google Trends - ‘Bitcoin halving’
Past 12 months

Searches for ‘Bitcoin halving’ has dropped slightly from its recent peak in early February where searches were the highest relative to all other points in the last 12 months.
Past 90 days
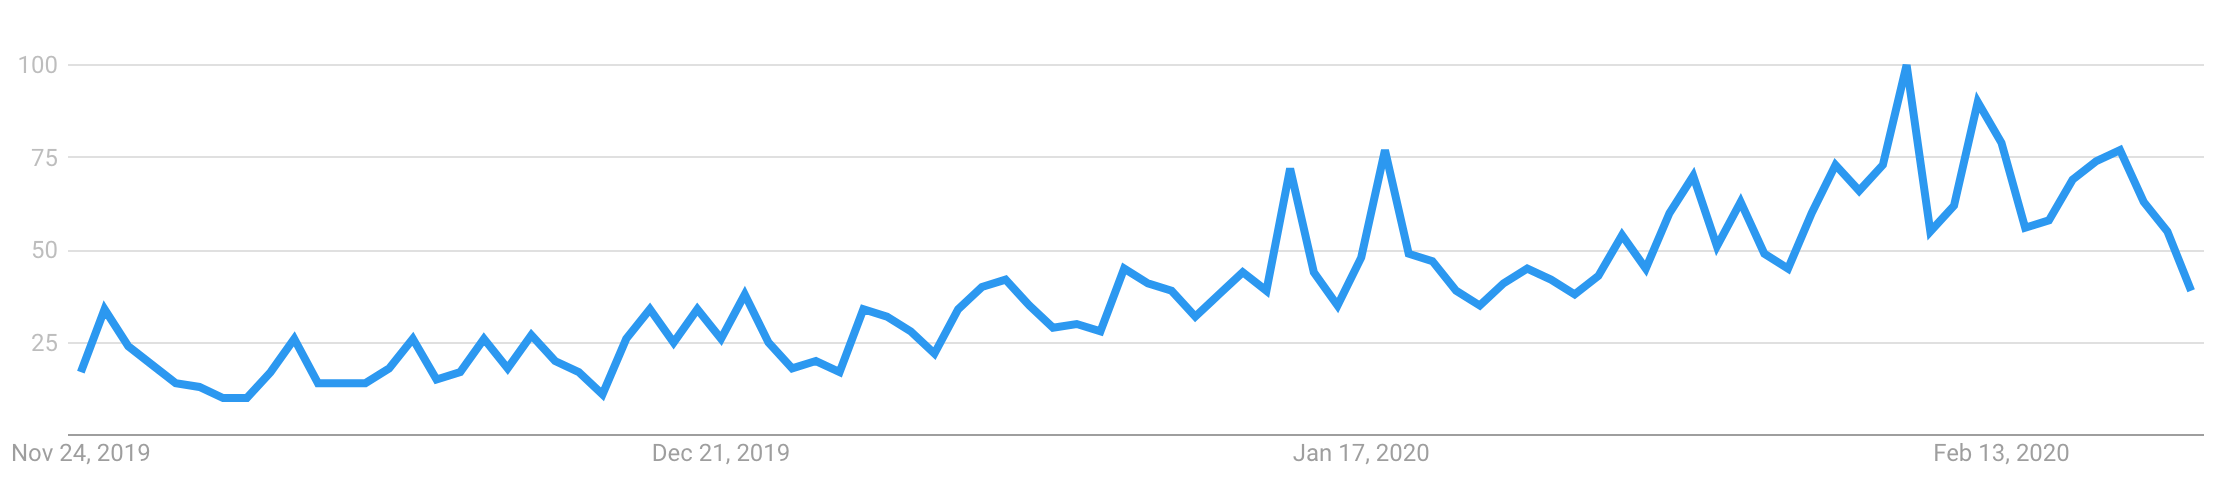
Looking at the last 90 days, searches for Bitcoin has decreased in the last few days which has broken the upwards trend over the period.
WeChat Index - ‘Bitcoin’

If we look at WeChat search index, searches for ‘Bitcoin’ has continued to show an upwards trend since the end of January with searches up 98% since then.
Confirmed Transactions Per Day
Represents the number of transactions completed on the Bitcoin network within a 24 hour period. The higher the number the more the network is being utilised.
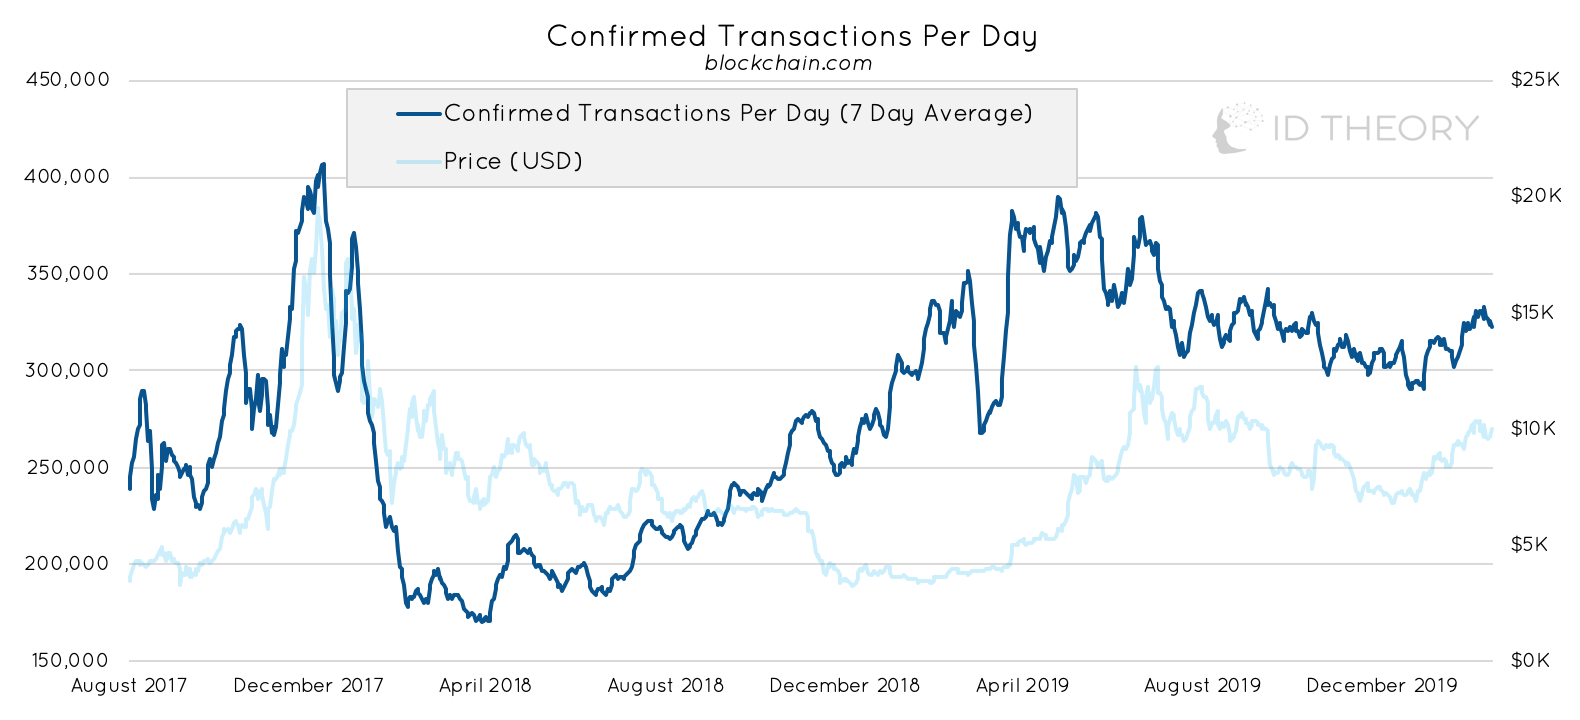
Confirmed transactions are down 2% since last week and up 10% YTD.
Mean Transaction Value
This is the average size of each transaction being processed by the Bitcoin network.
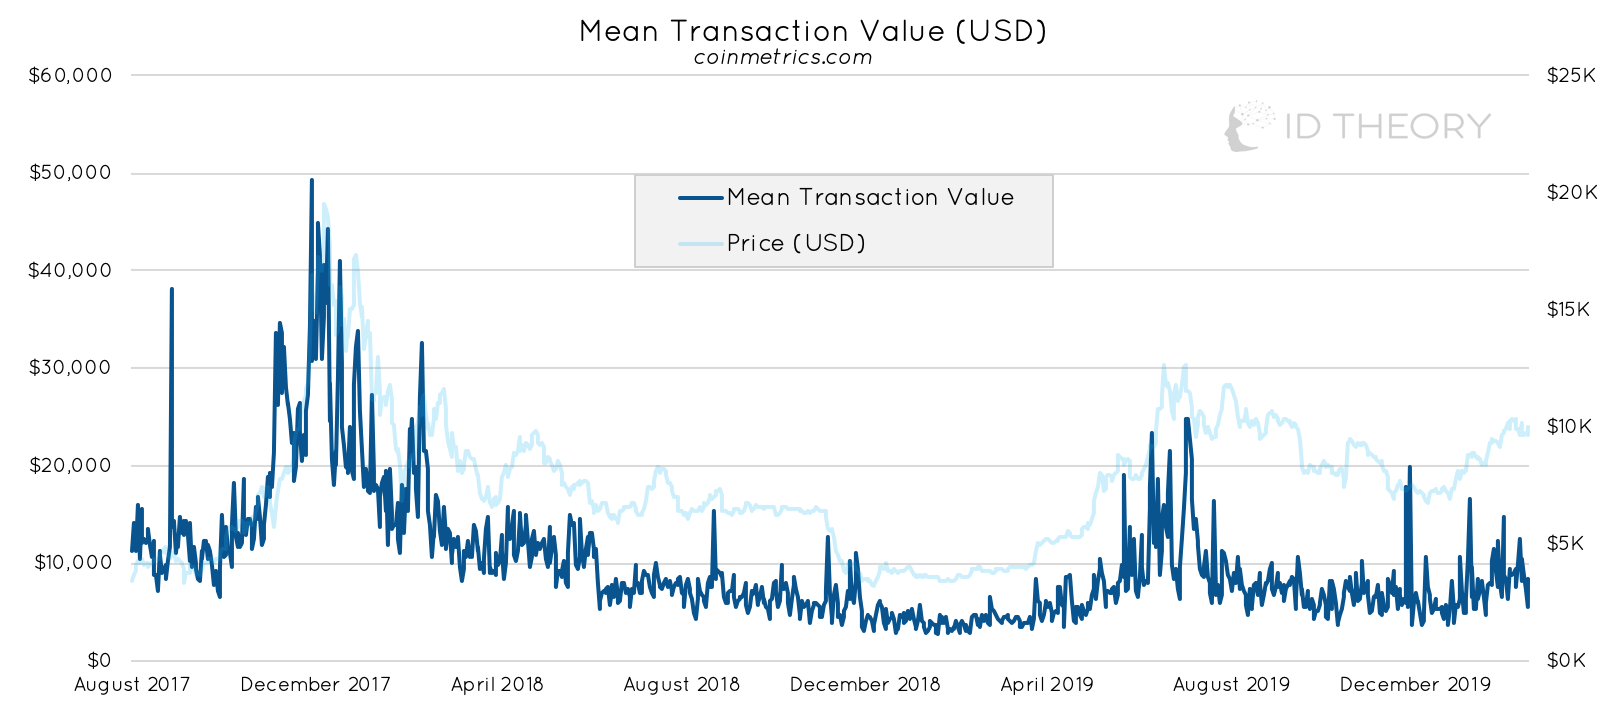
The mean transaction value has decreased 15% for the week and is up 127% YTD.
Bitcoin Economic Throughput
Economic throughput is the transactions per day multiplied by the mean transaction value. It is a measure of the financial bandwidth of the Bitcoin network per unit of time and represents the value flowing through the system.
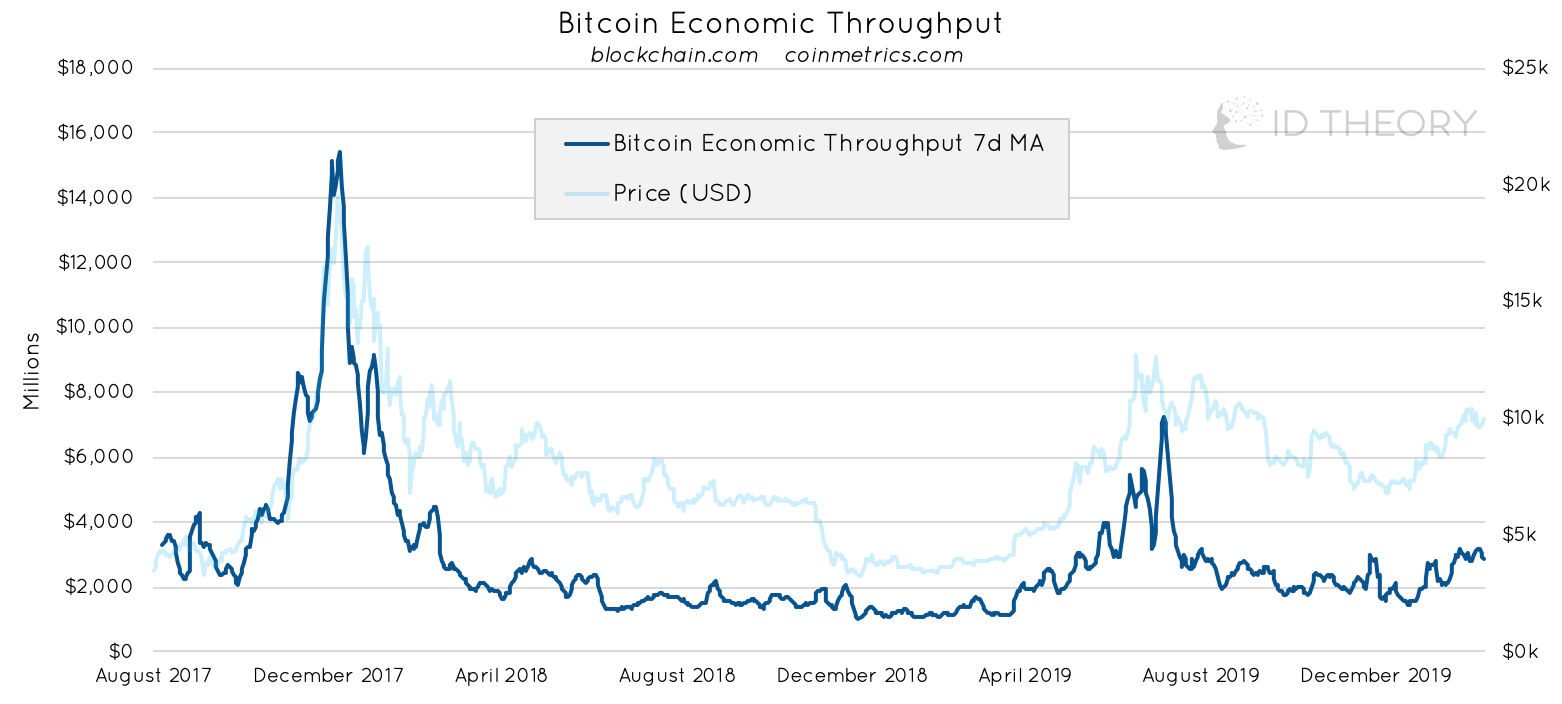
Current economic throughput is down 4% since last week hovering around $2.85Bn USD but is up 96% YTD on the 7d MA (moving average).
Hashrate
The Hashrate is a measure of the processing power contributed by miners to secure the network. A higher hashrate means more equipment and electricity (i.e. CapEx) being dedicated to mining bitcoin.
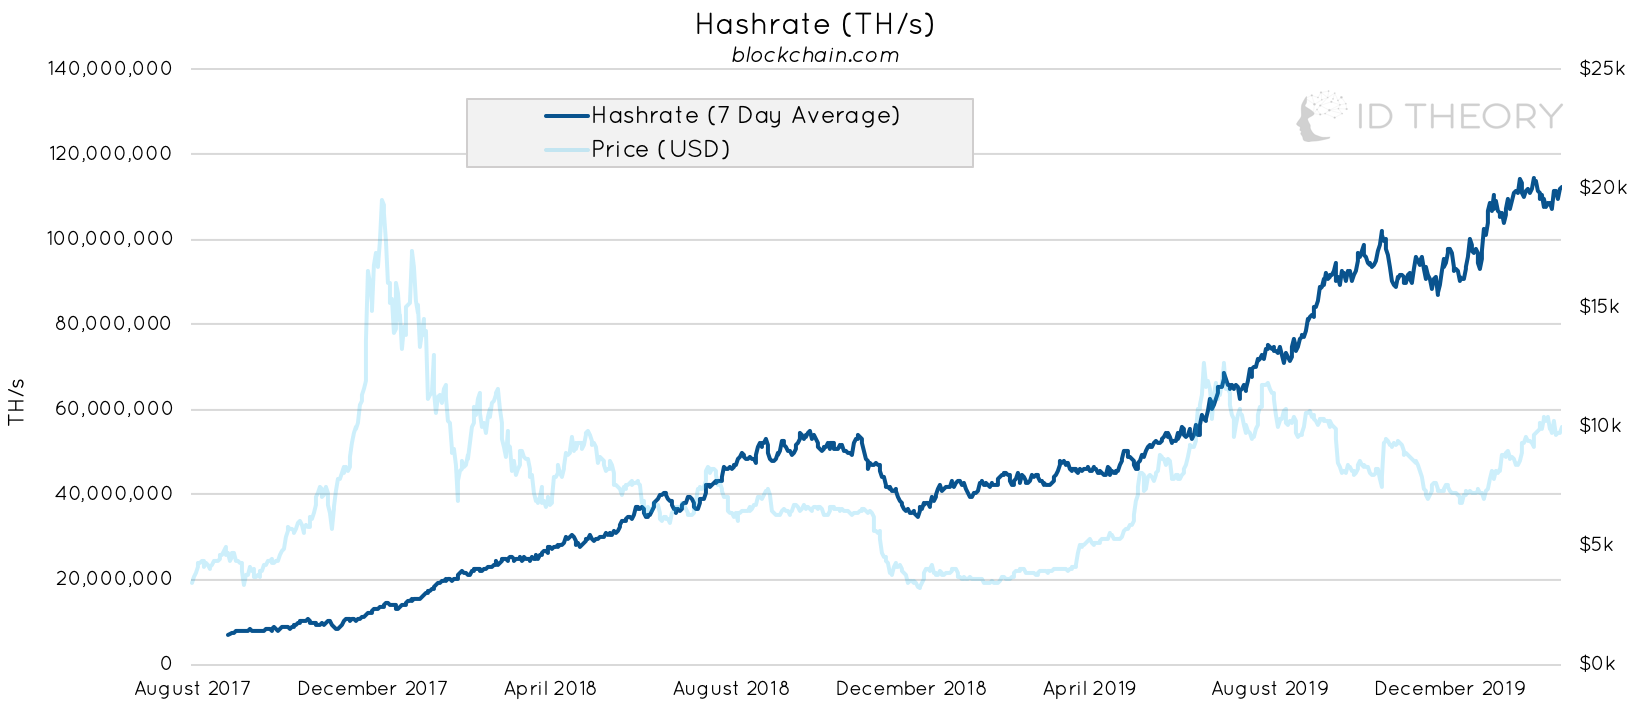
Bitcoin hashrate (7 day moving average) is up 4% for the week. Hashrate is up 16% YTD. Currently at 112m TH/s on the 7 day moving average.
Daily Active Addresses
The number of addresses sending or receiving bitcoin. It is a proxy for the number of people using the Bitcoin network.

The daily active addresses count for Bitcoin is down 5% from the last week. Active address count is still up 19% YTD.
Bitcoin Days Destroyed
Bitcoin Days Destroyed (BDD) is an alternative metric for transaction volume on the Bitcoin network. It is calculated by taking the number of Bitcoins in a transaction and multiplying it by the number of days it has been since those coins were last spent.
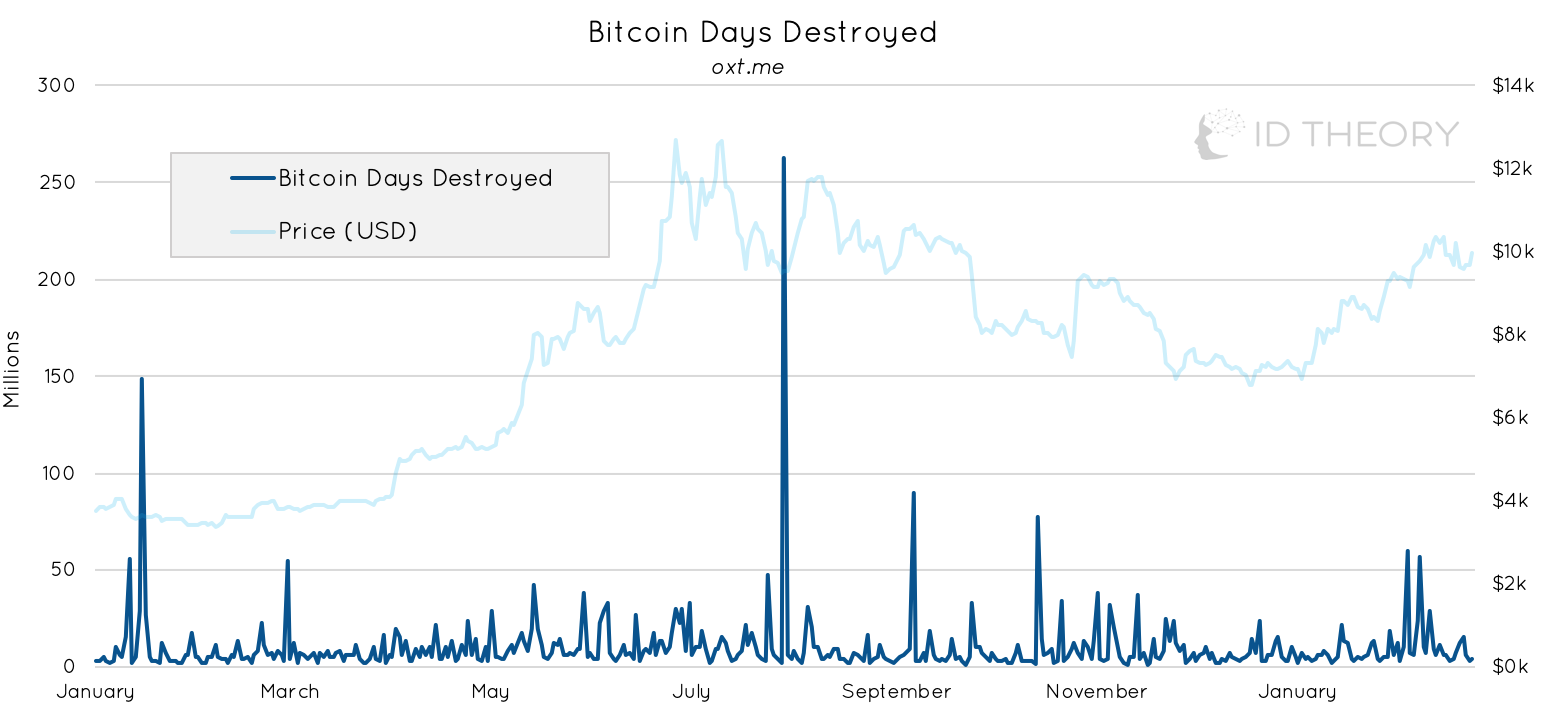
During the last week there has not been any significant BDD activity observed.
Realised Cap
This metric approximates the value paid for all coins in existence by summing the market value of coins at the time they last moved on the blockchain. It was developed by the Coinmetrics team in response to the flaws inherent with looking at traditional Market Capitalisation (MCap).
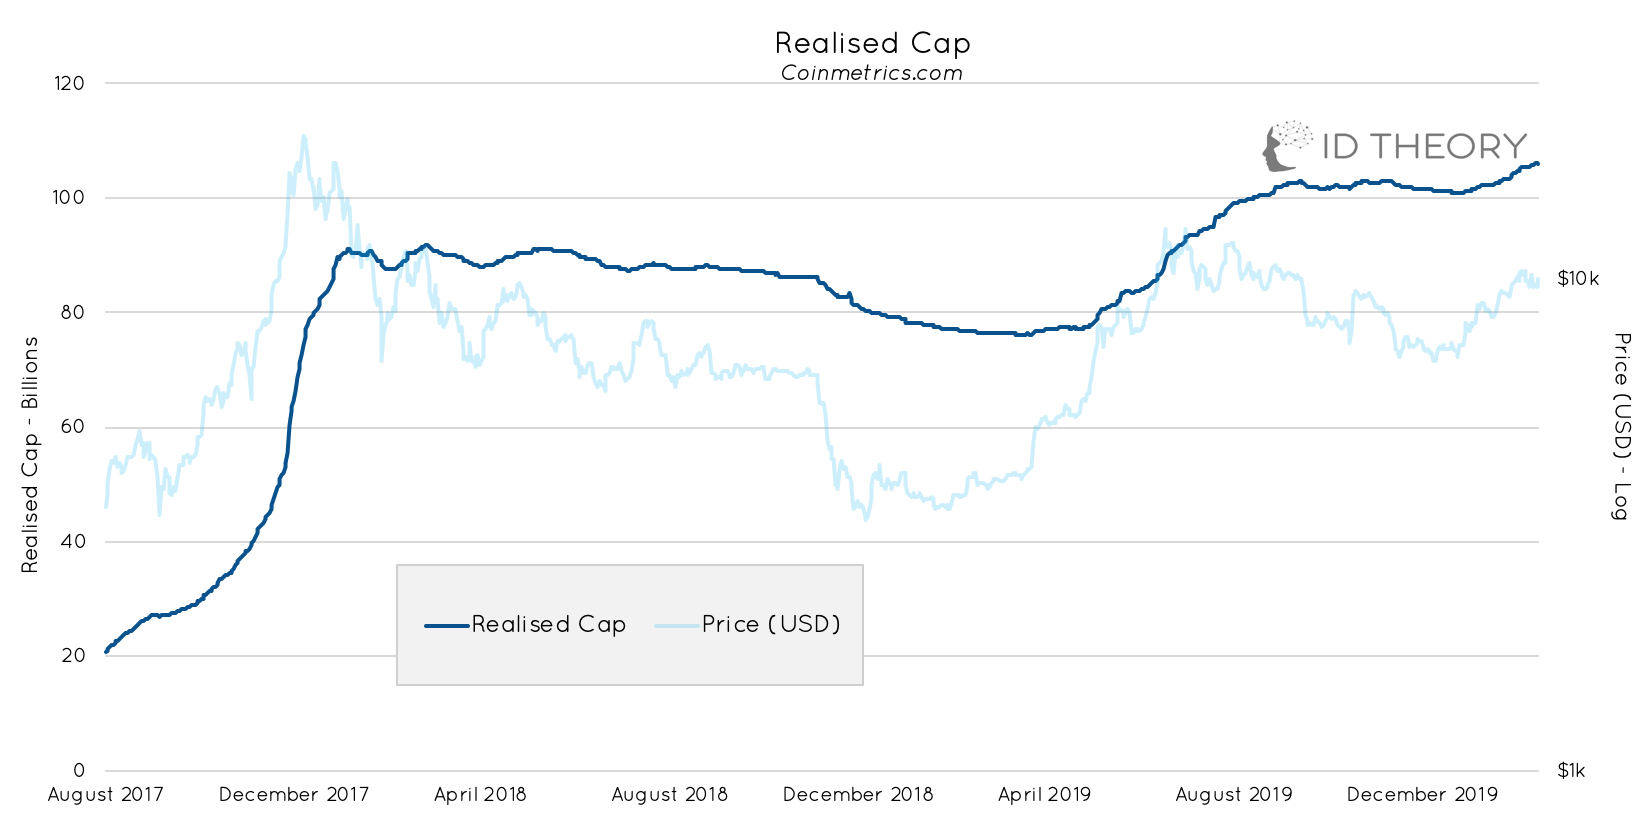
Realised Cap is at ATH with it currently standing at ~$106.1 Bn.
MVRV
Market Value/ Realised Value (MVRV) is simply the ratio comparing market cap and realised cap. When the MVRV is high then it might be an indication that the traded price might be above BTC’s ‘fair value’.

Historically, two important thresholds can be observed - MVRV above 3.7 could signal potential overvaluation and MVRV below 1 could signal undervaluation. The ratio ratio is currently at ~1.71.
Lightning Nodes
The Lightning Network is a "Layer 2" payment protocol that operates on top of Bitcoin). It enables fast transactions among participating nodes and has been touted as a solution to the Bitcoin scalability problem. An increasing number of nodes represents the growth and decentralisation of this network.
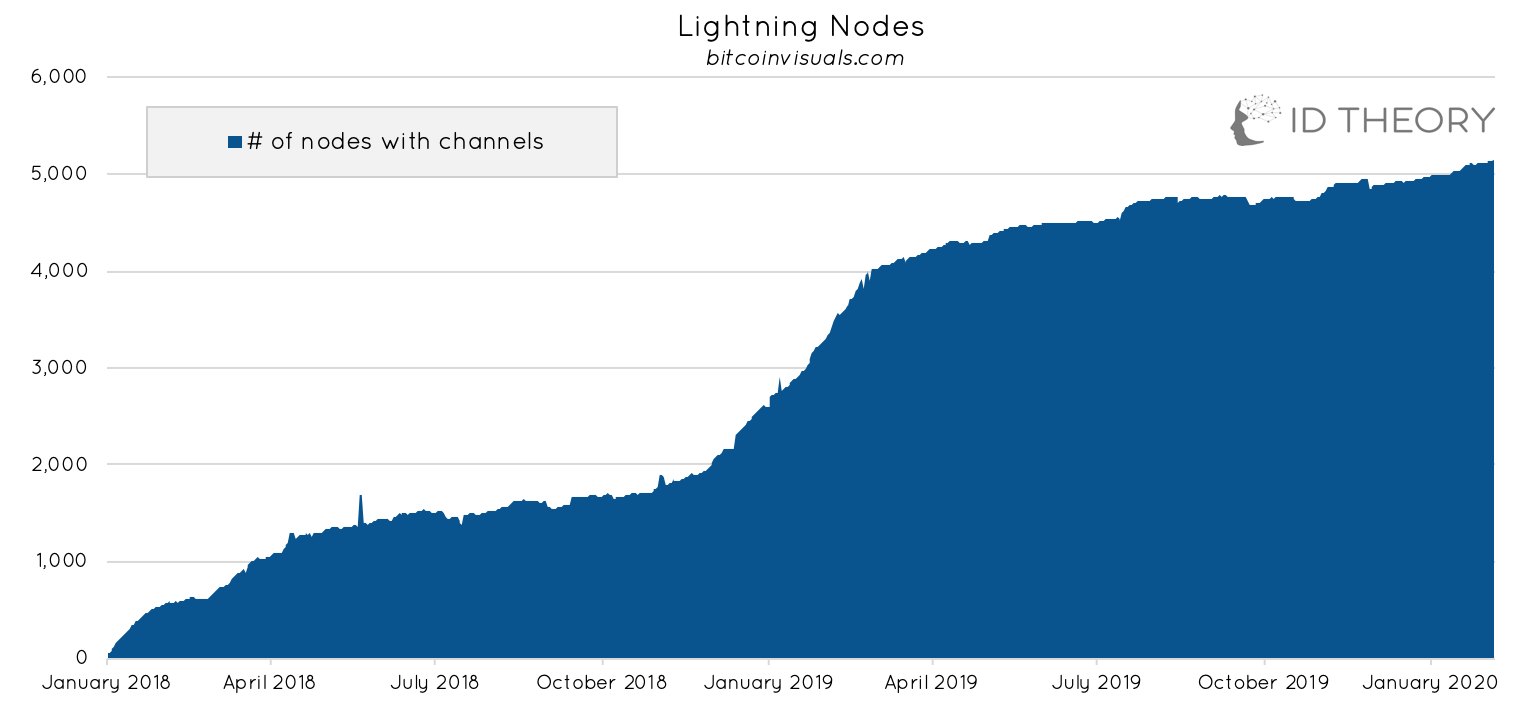
The number of unique lightning nodes on the Bitcoin network is up 1% for the week. The number of nodes is up 4% YTD.
Lightning Channels
Lighting channels enable users on the lighting network to send and receive money to and from other users. Once established they allow payments to stream seamlessly between two peers.
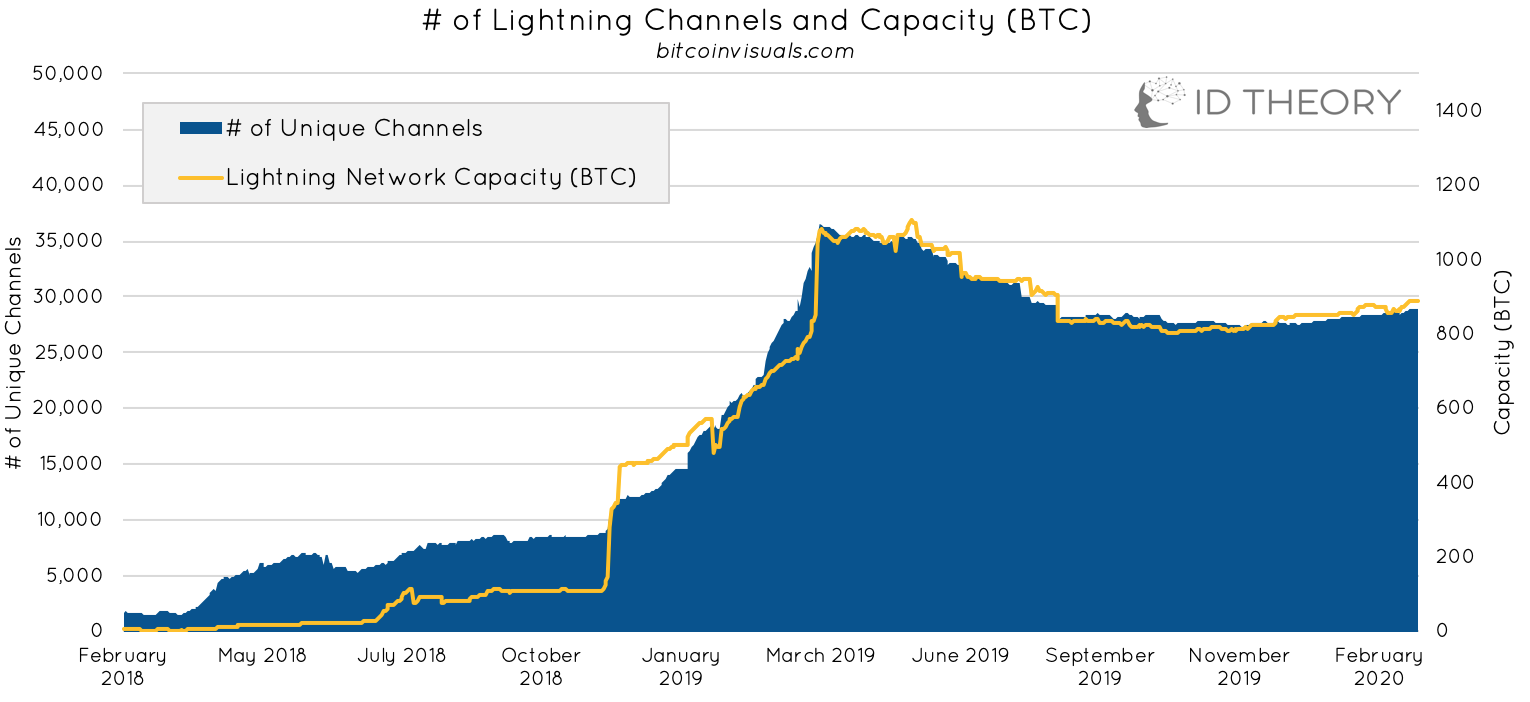
The number of unique channels on the lightning network increased 1% in the last week. The BTC capacity on the Lightning Network has increased by 1% (total capacity is ~887 BTC).
Wrapped BTC
Wrapped BTC represents bitcoin that has been locked in a smart contract to be deployed on Ethereum as an ERC20 token. This allows bitcoin holders to utilise the value of their bitcoin within the Ethereum ecosystem.

The total value of Wrapped BTC has climbed 16% in the past week. There are now 887 WBTC.
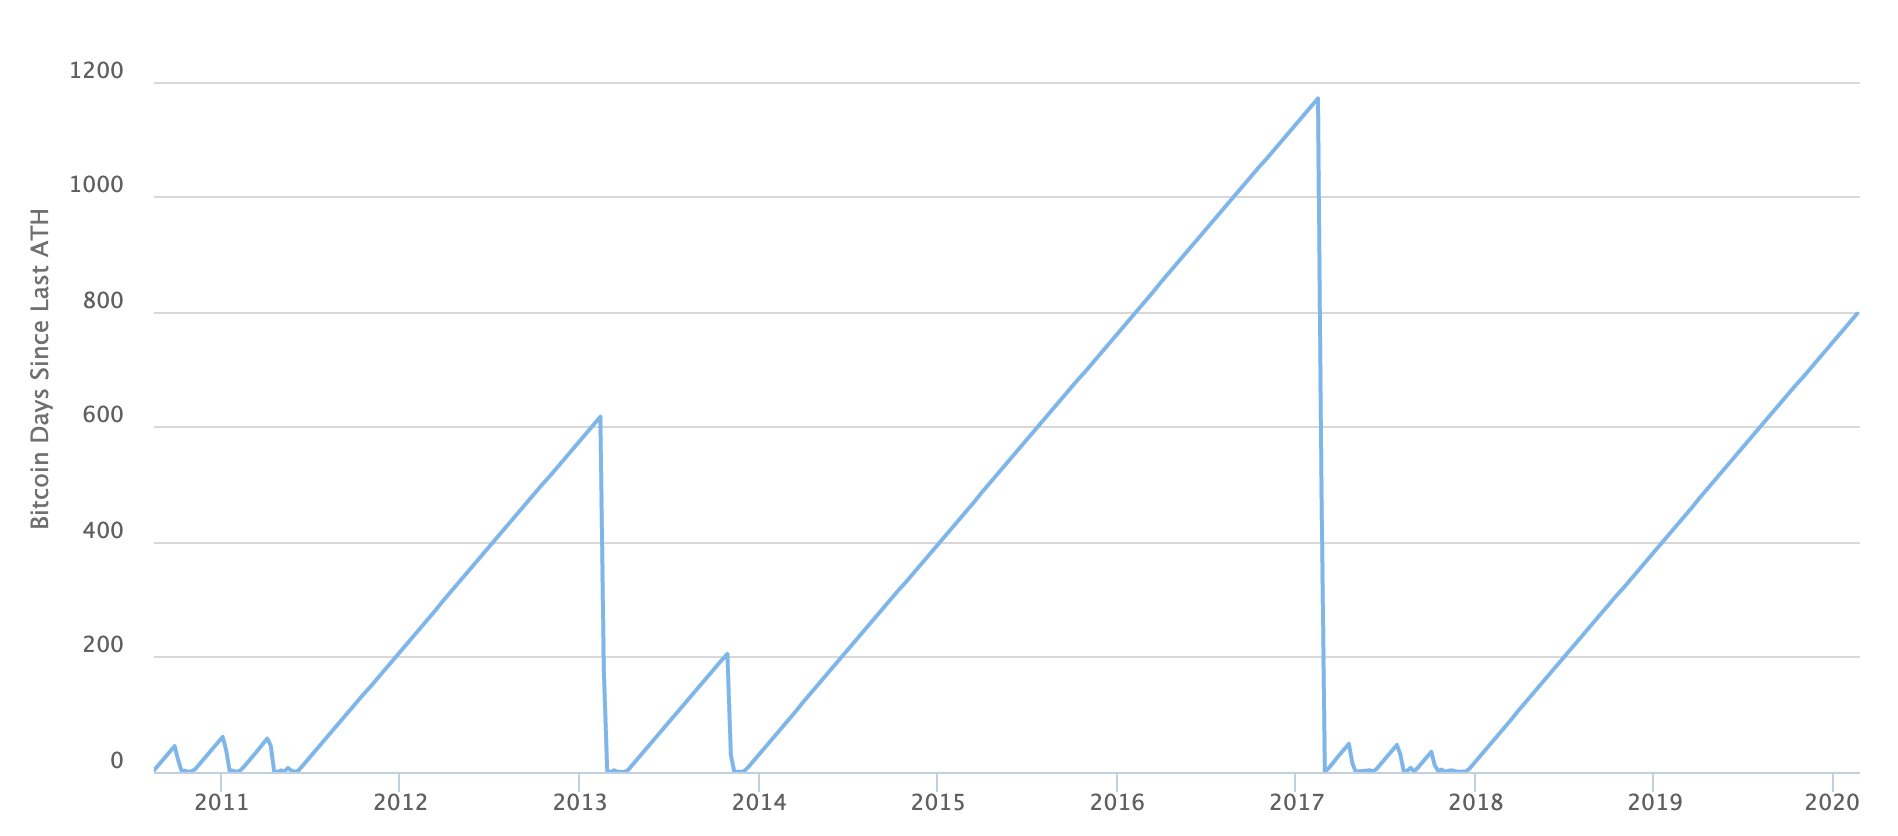
BTC Days Since All Time High
Spotlight


This week’s spotlight looks at the global distribution of Bitcoin by analysing number of addresses holding at least 1 BTC. On the 20th February, the number of addresses reached an ATH of 788.8k.
Tweet of the Week


Our ‘tweet of the week’ come from independent crypto researcher and CoinDesk columnist Hasu who argued that concentration of hashpower is not necessarily a security concern for Bitcoin due to what miners may lose in terms of opportunity cost by attacking the network instead. Hasu later wrote a detailed part 2 where he responds to some of the most common questions asked in response to his original article.

About the Author
Lewis Harland is an analyst at ID Theory and is a full time researcher of decentralised networks and cryptoassets.
ID Theory Ltd. is an Investment Advisor for cryptoasset investment fund, IDT Crypto Asset Fund Ltd.
Interested in partnering with ID Theory or building something special? Get in touch through our website or at info@idtheory.io.