ID Theory is a London-based cryptoasset investment firm. Our weekly Insights report provides the latest key macro as well as on-chain data for Bitcoin. If you would like to receive insights directly to your inbox, you can subscribe here.
Correlations
Historically bitcoin has clearly demonstrated that it is uncorrelated to any other asset. However, given the adoption and evolving use cases of bitcoin, it can be useful to look at particular groups of assets for emerging correlation:
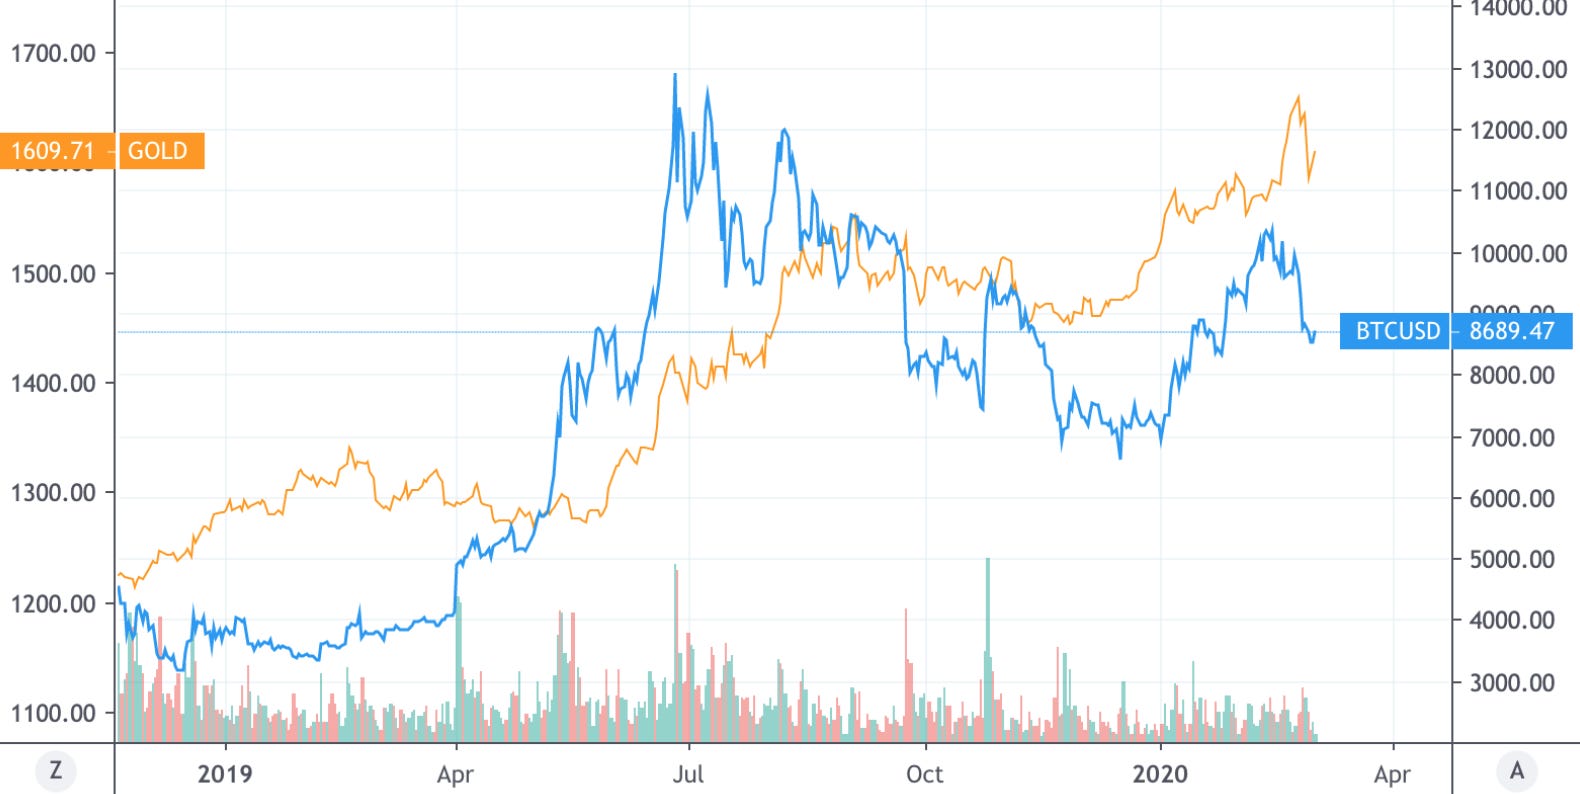
BTC and Gold
Gold has served as a safe haven asset for 1000’s of years.
![](https://substackcdn.com/image/fetch/w_1456,c_limit,f_auto,q_auto:good,fl_progressive:steep/https%3A%2F%2Fbucketeer-e05bbc84-baa3-437e-9518-adb32be77984.s3.amazonaws.com%2Fpublic%2Fimages%2F49e7c487-420b-4db5-af03-02eeb0d533f3_1580x794.png)
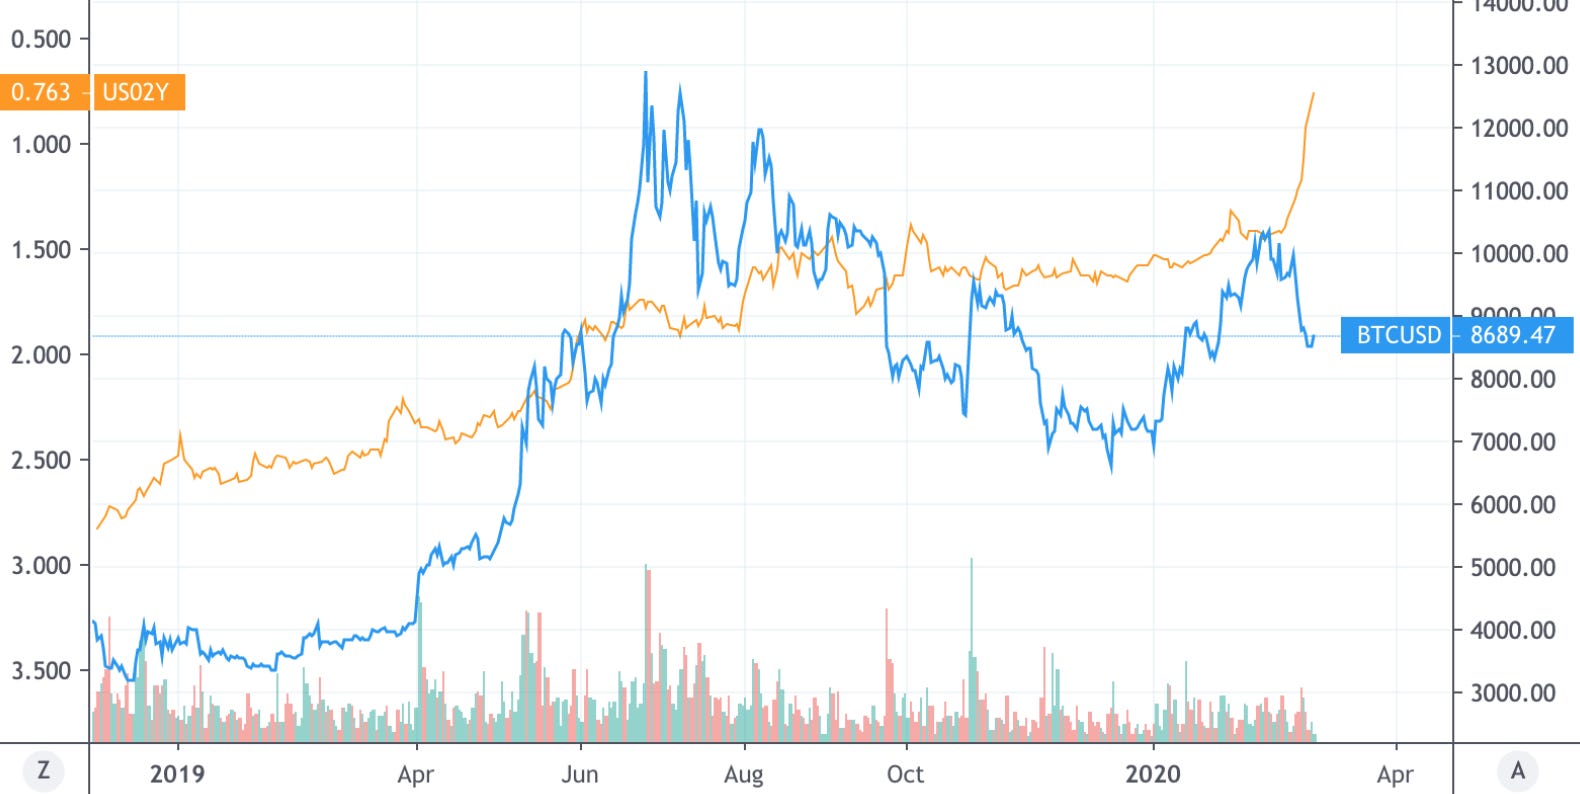
BTC and Inverted US 2 Year Treasury Yield
In a risk-off environment Treasury yields drop (and hence inverted yields rise).
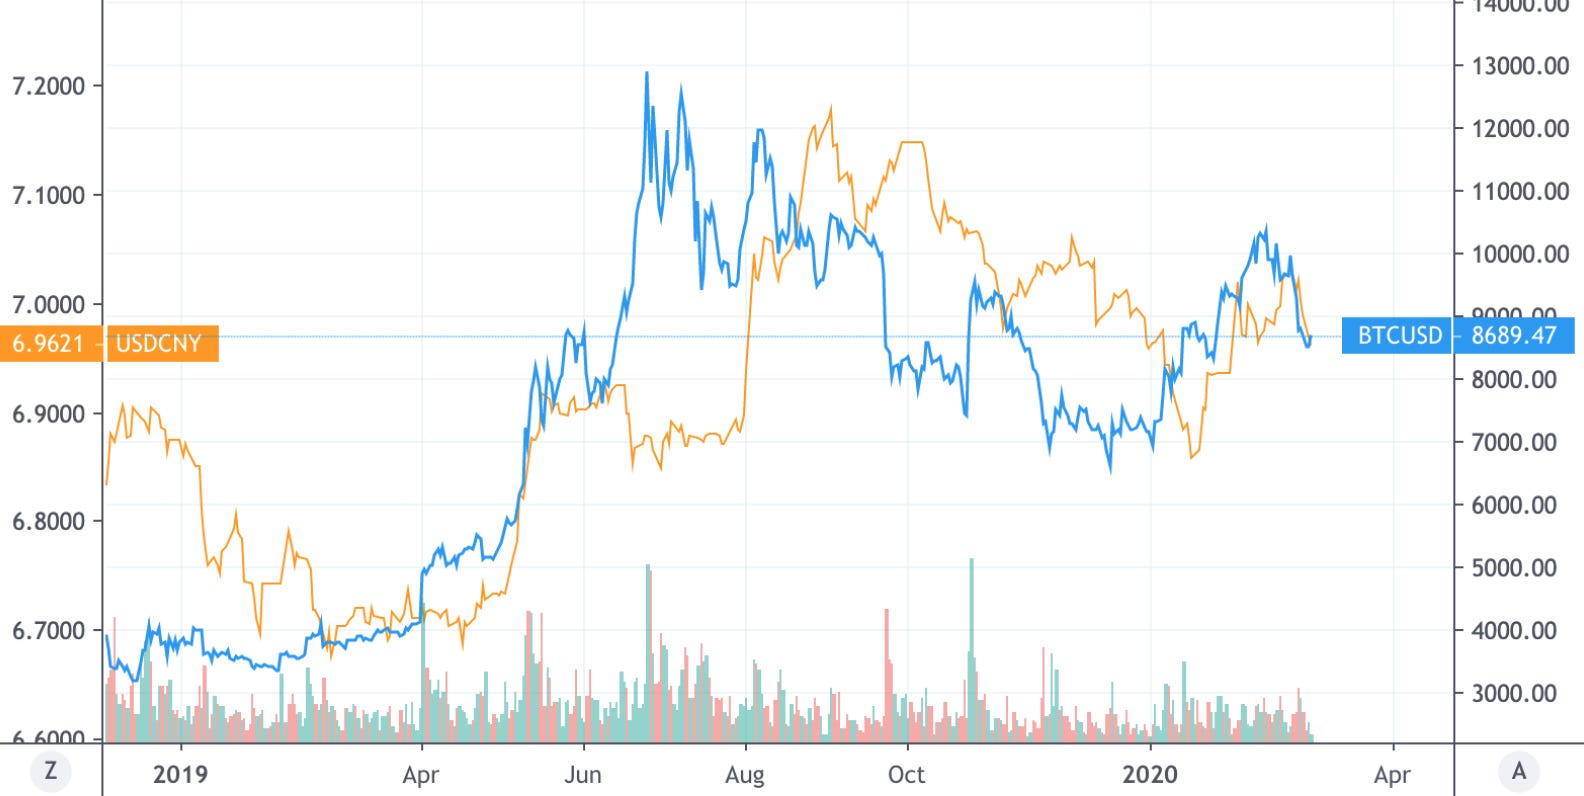
![](https://substackcdn.com/image/fetch/w_1456,c_limit,f_auto,q_auto:good,fl_progressive:steep/https%3A%2F%2Fbucketeer-e05bbc84-baa3-437e-9518-adb32be77984.s3.amazonaws.com%2Fpublic%2Fimages%2F6d81f5c3-9c38-4487-9e78-b582dd5cf375_1580x794.png)
BTC and USD/CNY
Weakening CNY may lead to a greater demand for capital flight from China.
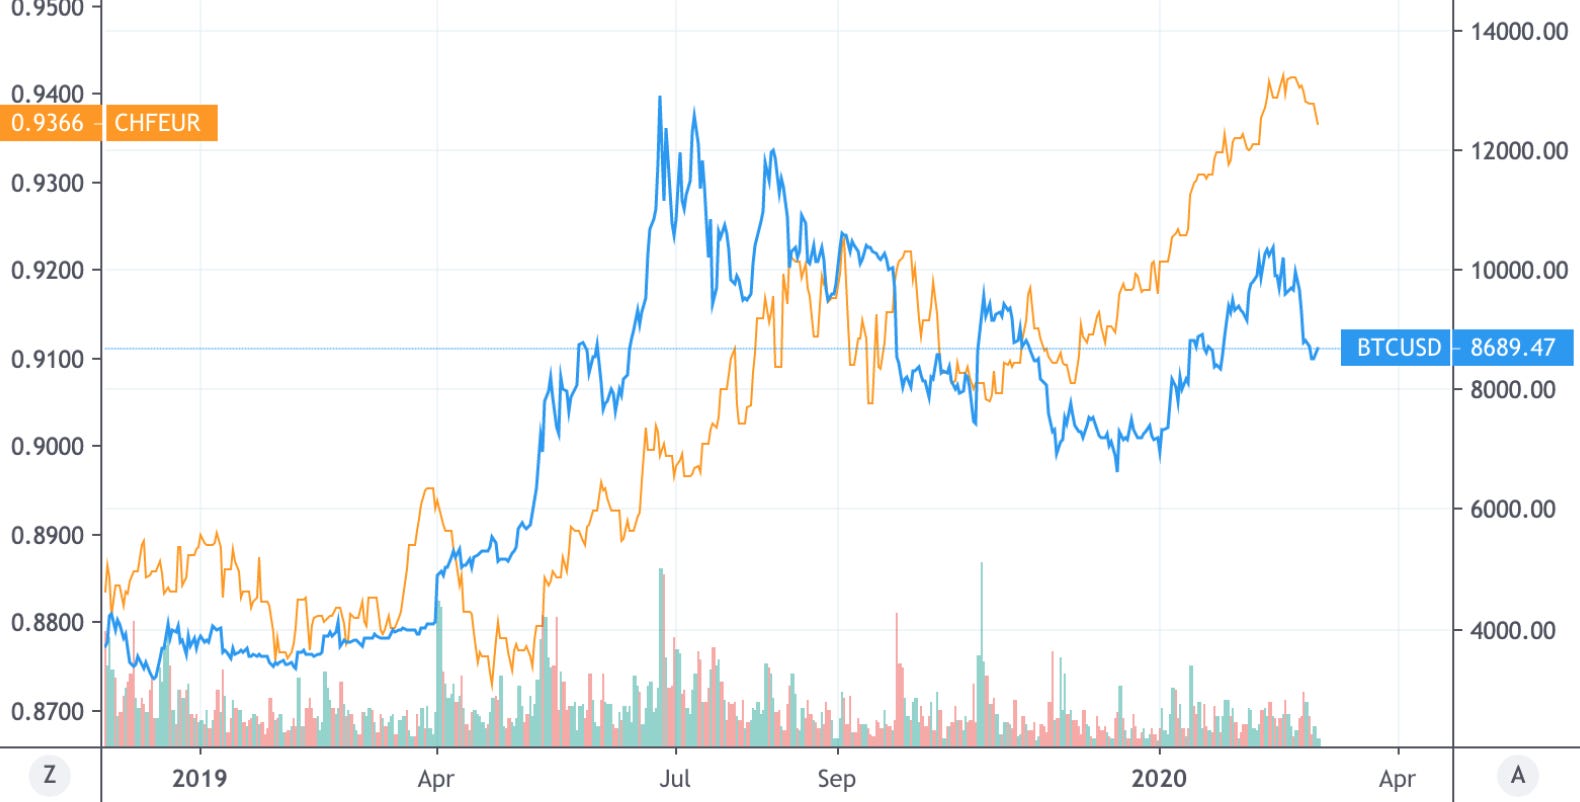
![](https://substackcdn.com/image/fetch/w_1456,c_limit,f_auto,q_auto:good,fl_progressive:steep/https%3A%2F%2Fbucketeer-e05bbc84-baa3-437e-9518-adb32be77984.s3.amazonaws.com%2Fpublic%2Fimages%2Fbfc8675a-f39c-4151-8f24-9bc281feebc3_1584x796.png)
BTC and CHF/EUR
The Swiss Franc (CHF) is a safe haven currency.
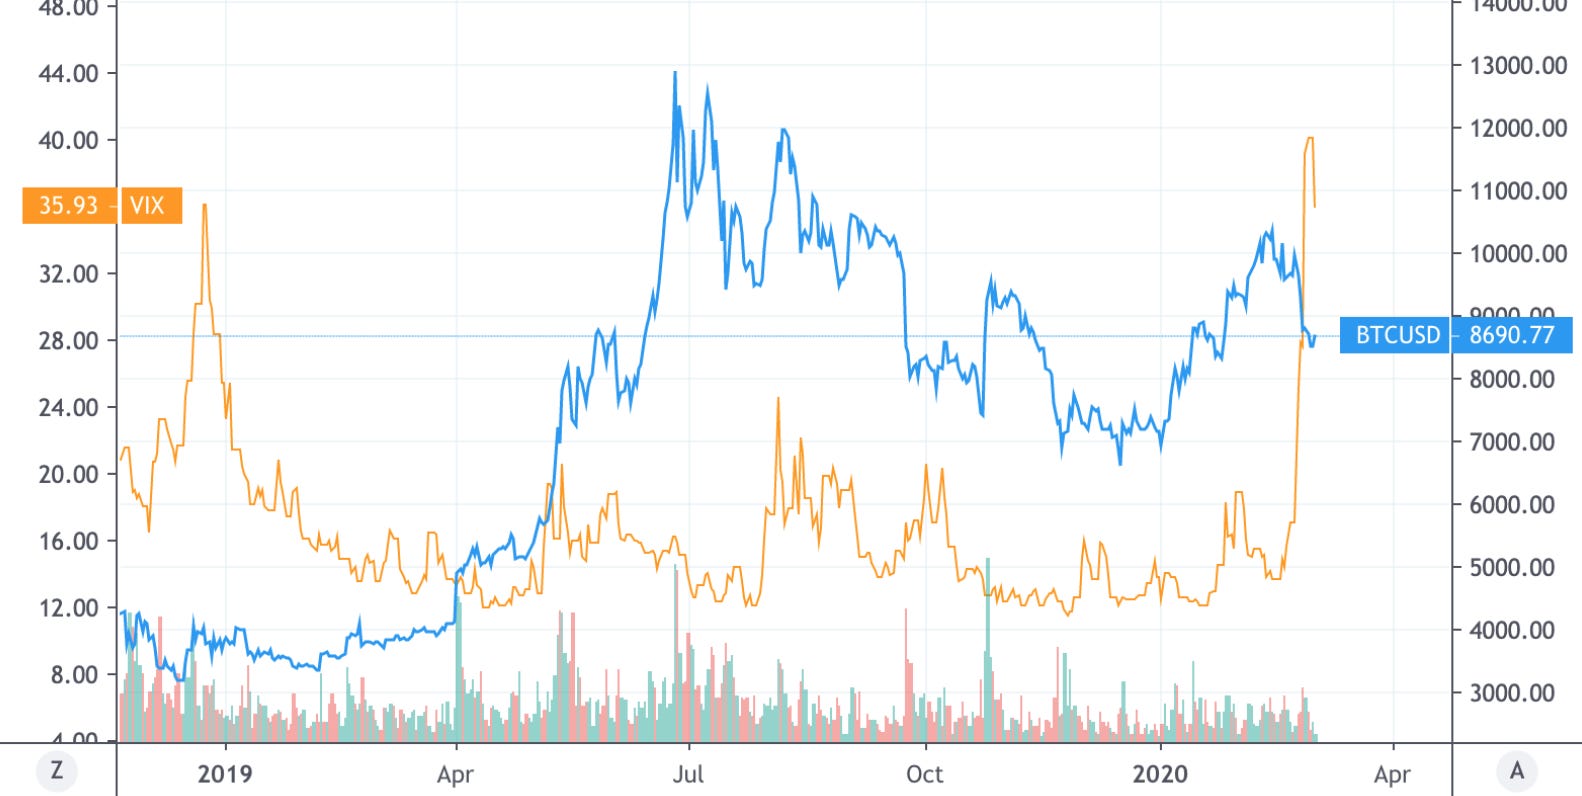
![](https://substackcdn.com/image/fetch/w_1456,c_limit,f_auto,q_auto:good,fl_progressive:steep/https%3A%2F%2Fbucketeer-e05bbc84-baa3-437e-9518-adb32be77984.s3.amazonaws.com%2Fpublic%2Fimages%2Fa2e62351-95f7-414d-bc39-224351cb7457_1580x802.png)
BTC and VIX
Volatility (represented by the VIX) generally increases in times of economic uncertainty.
![](https://substackcdn.com/image/fetch/w_1456,c_limit,f_auto,q_auto:good,fl_progressive:steep/https%3A%2F%2Fbucketeer-e05bbc84-baa3-437e-9518-adb32be77984.s3.amazonaws.com%2Fpublic%2Fimages%2F71bb3352-dcc3-49e1-ba66-5f0df48ee2ce_1582x796.png)
BTC and SMAs
Simple moving averages (SMA’s) smooth price histories by averaging daily prices over a given period of time. Crossing moving averages represent a shift in momentum.
![](https://substackcdn.com/image/fetch/w_1456,c_limit,f_auto,q_auto:good,fl_progressive:steep/https%3A%2F%2Fbucketeer-e05bbc84-baa3-437e-9518-adb32be77984.s3.amazonaws.com%2Fpublic%2Fimages%2Feb8c8810-c207-4ddd-b10e-0308c11c46da_3284x1650.png)
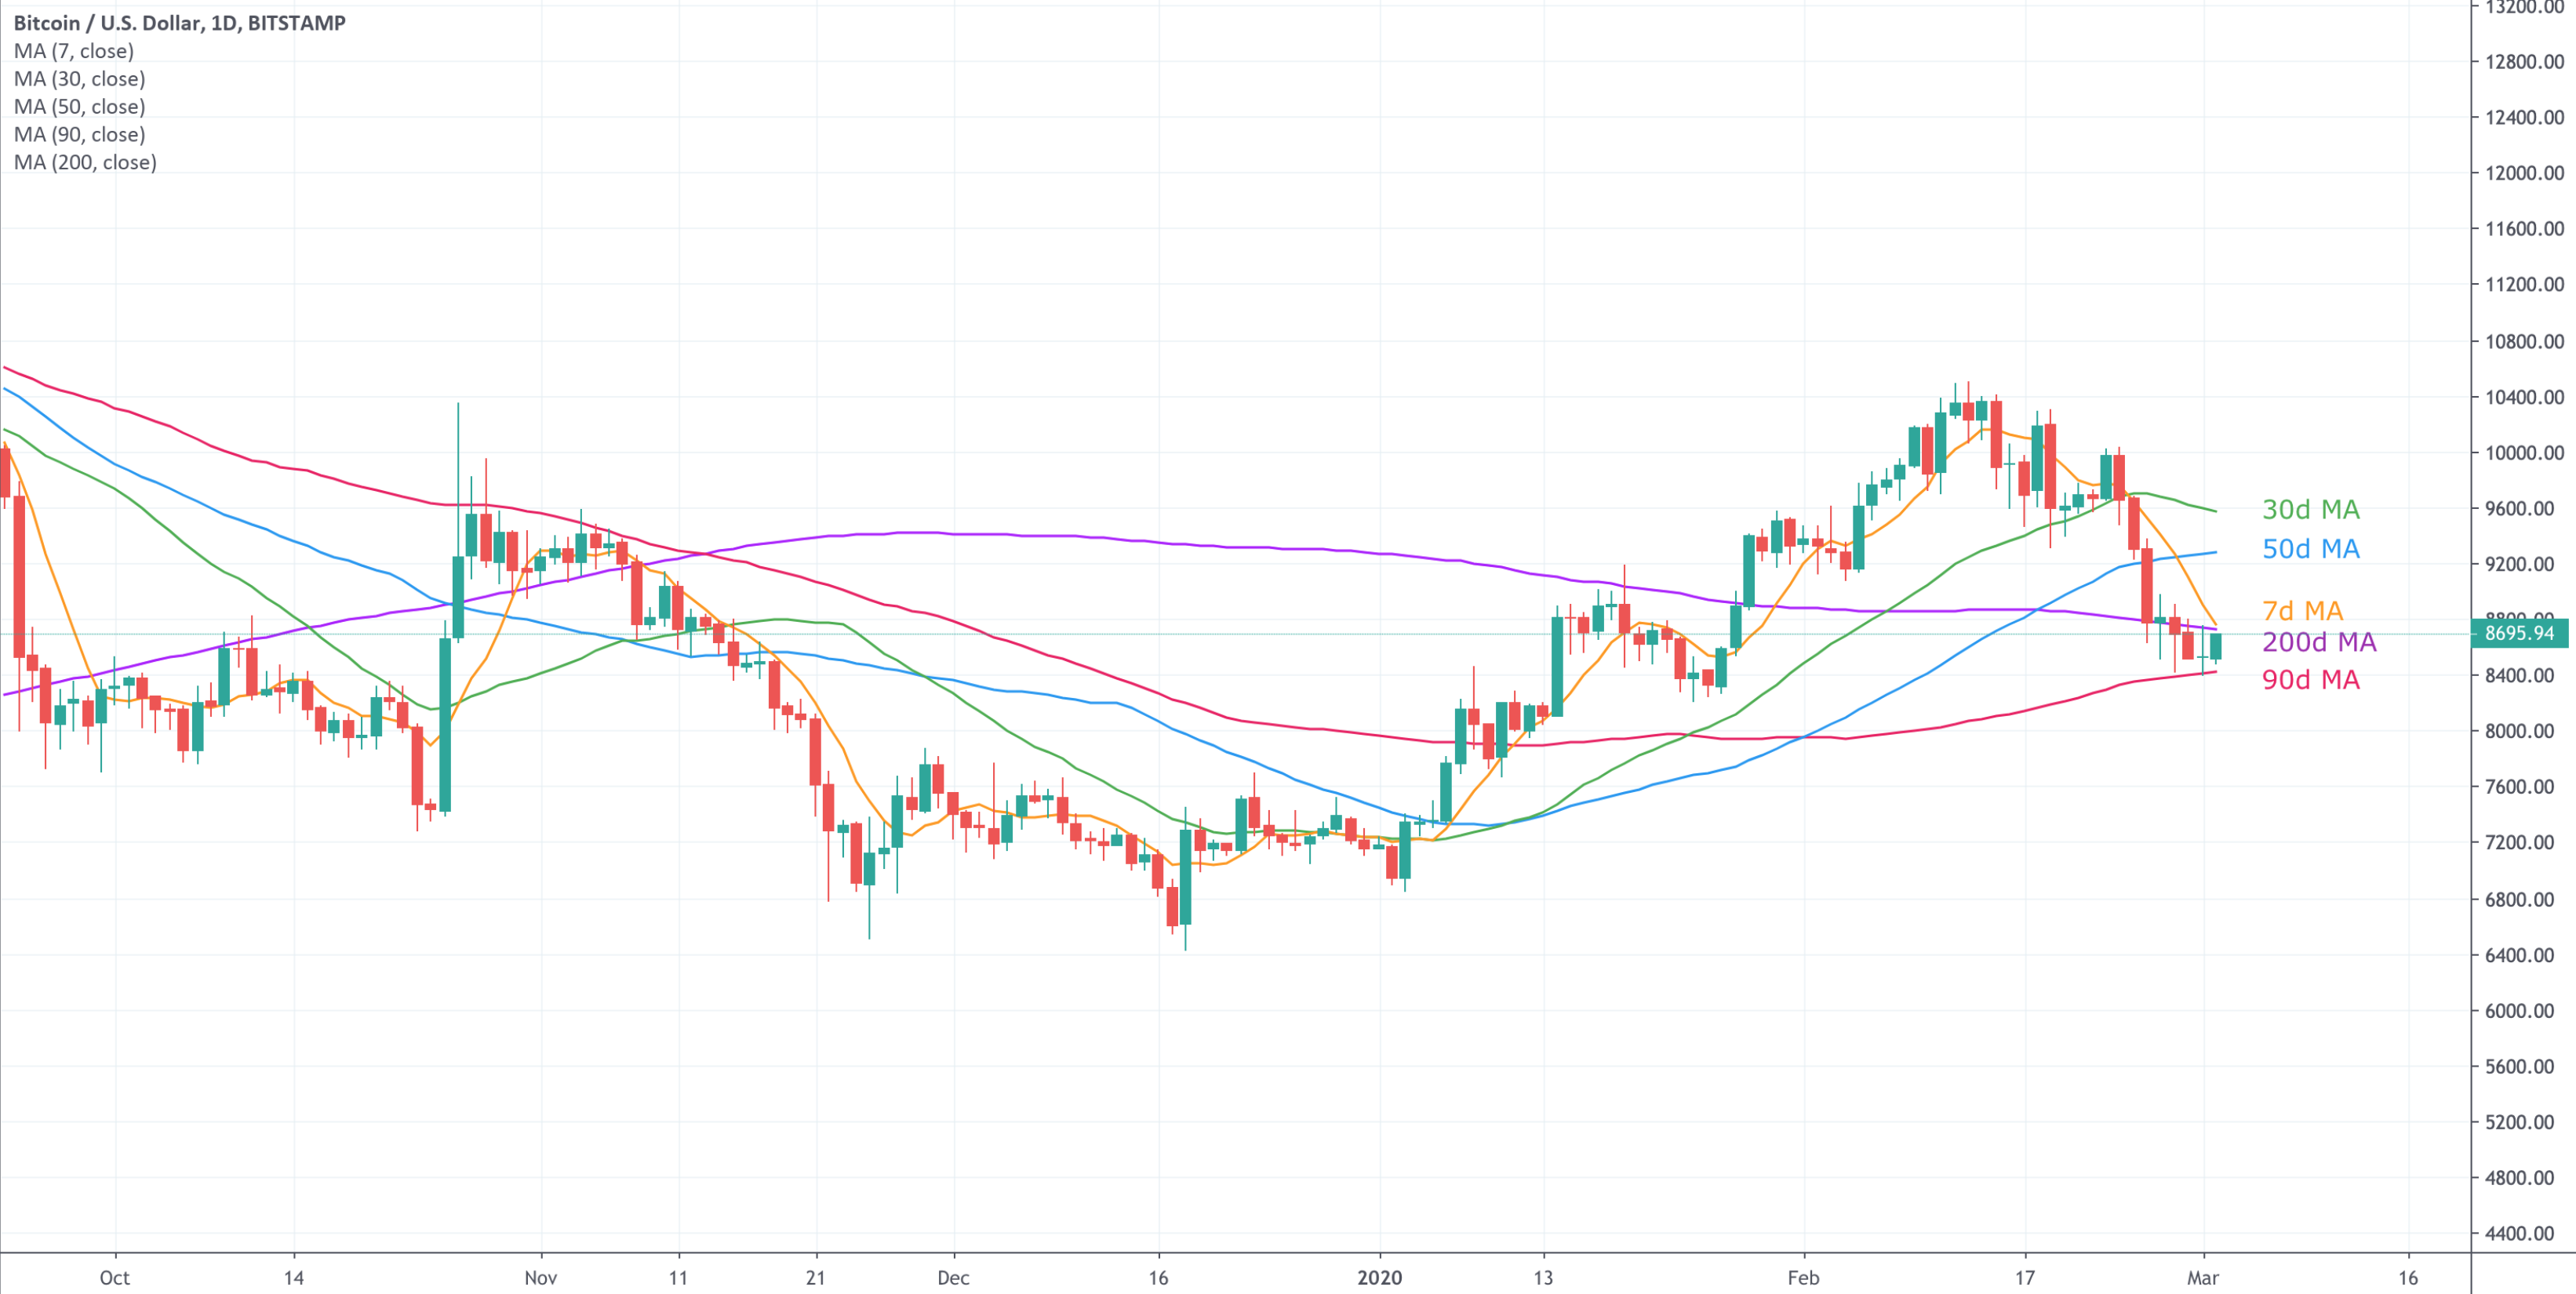
Despite the 50-day moving average crossing above the 200-day moving average earlier this month, bearish momentum continued last week with 7-day moving average crossing below the 30d as well as the 50d moving average. The 7-day moving average is set to cross below the 200d moving average in the coming days.
BTC and MACD
![](https://substackcdn.com/image/fetch/w_1456,c_limit,f_auto,q_auto:good,fl_progressive:steep/https%3A%2F%2Fbucketeer-e05bbc84-baa3-437e-9518-adb32be77984.s3.amazonaws.com%2Fpublic%2Fimages%2F7bb6b81c-9531-4ed3-8372-193d8656bc36_3276x1648.png)
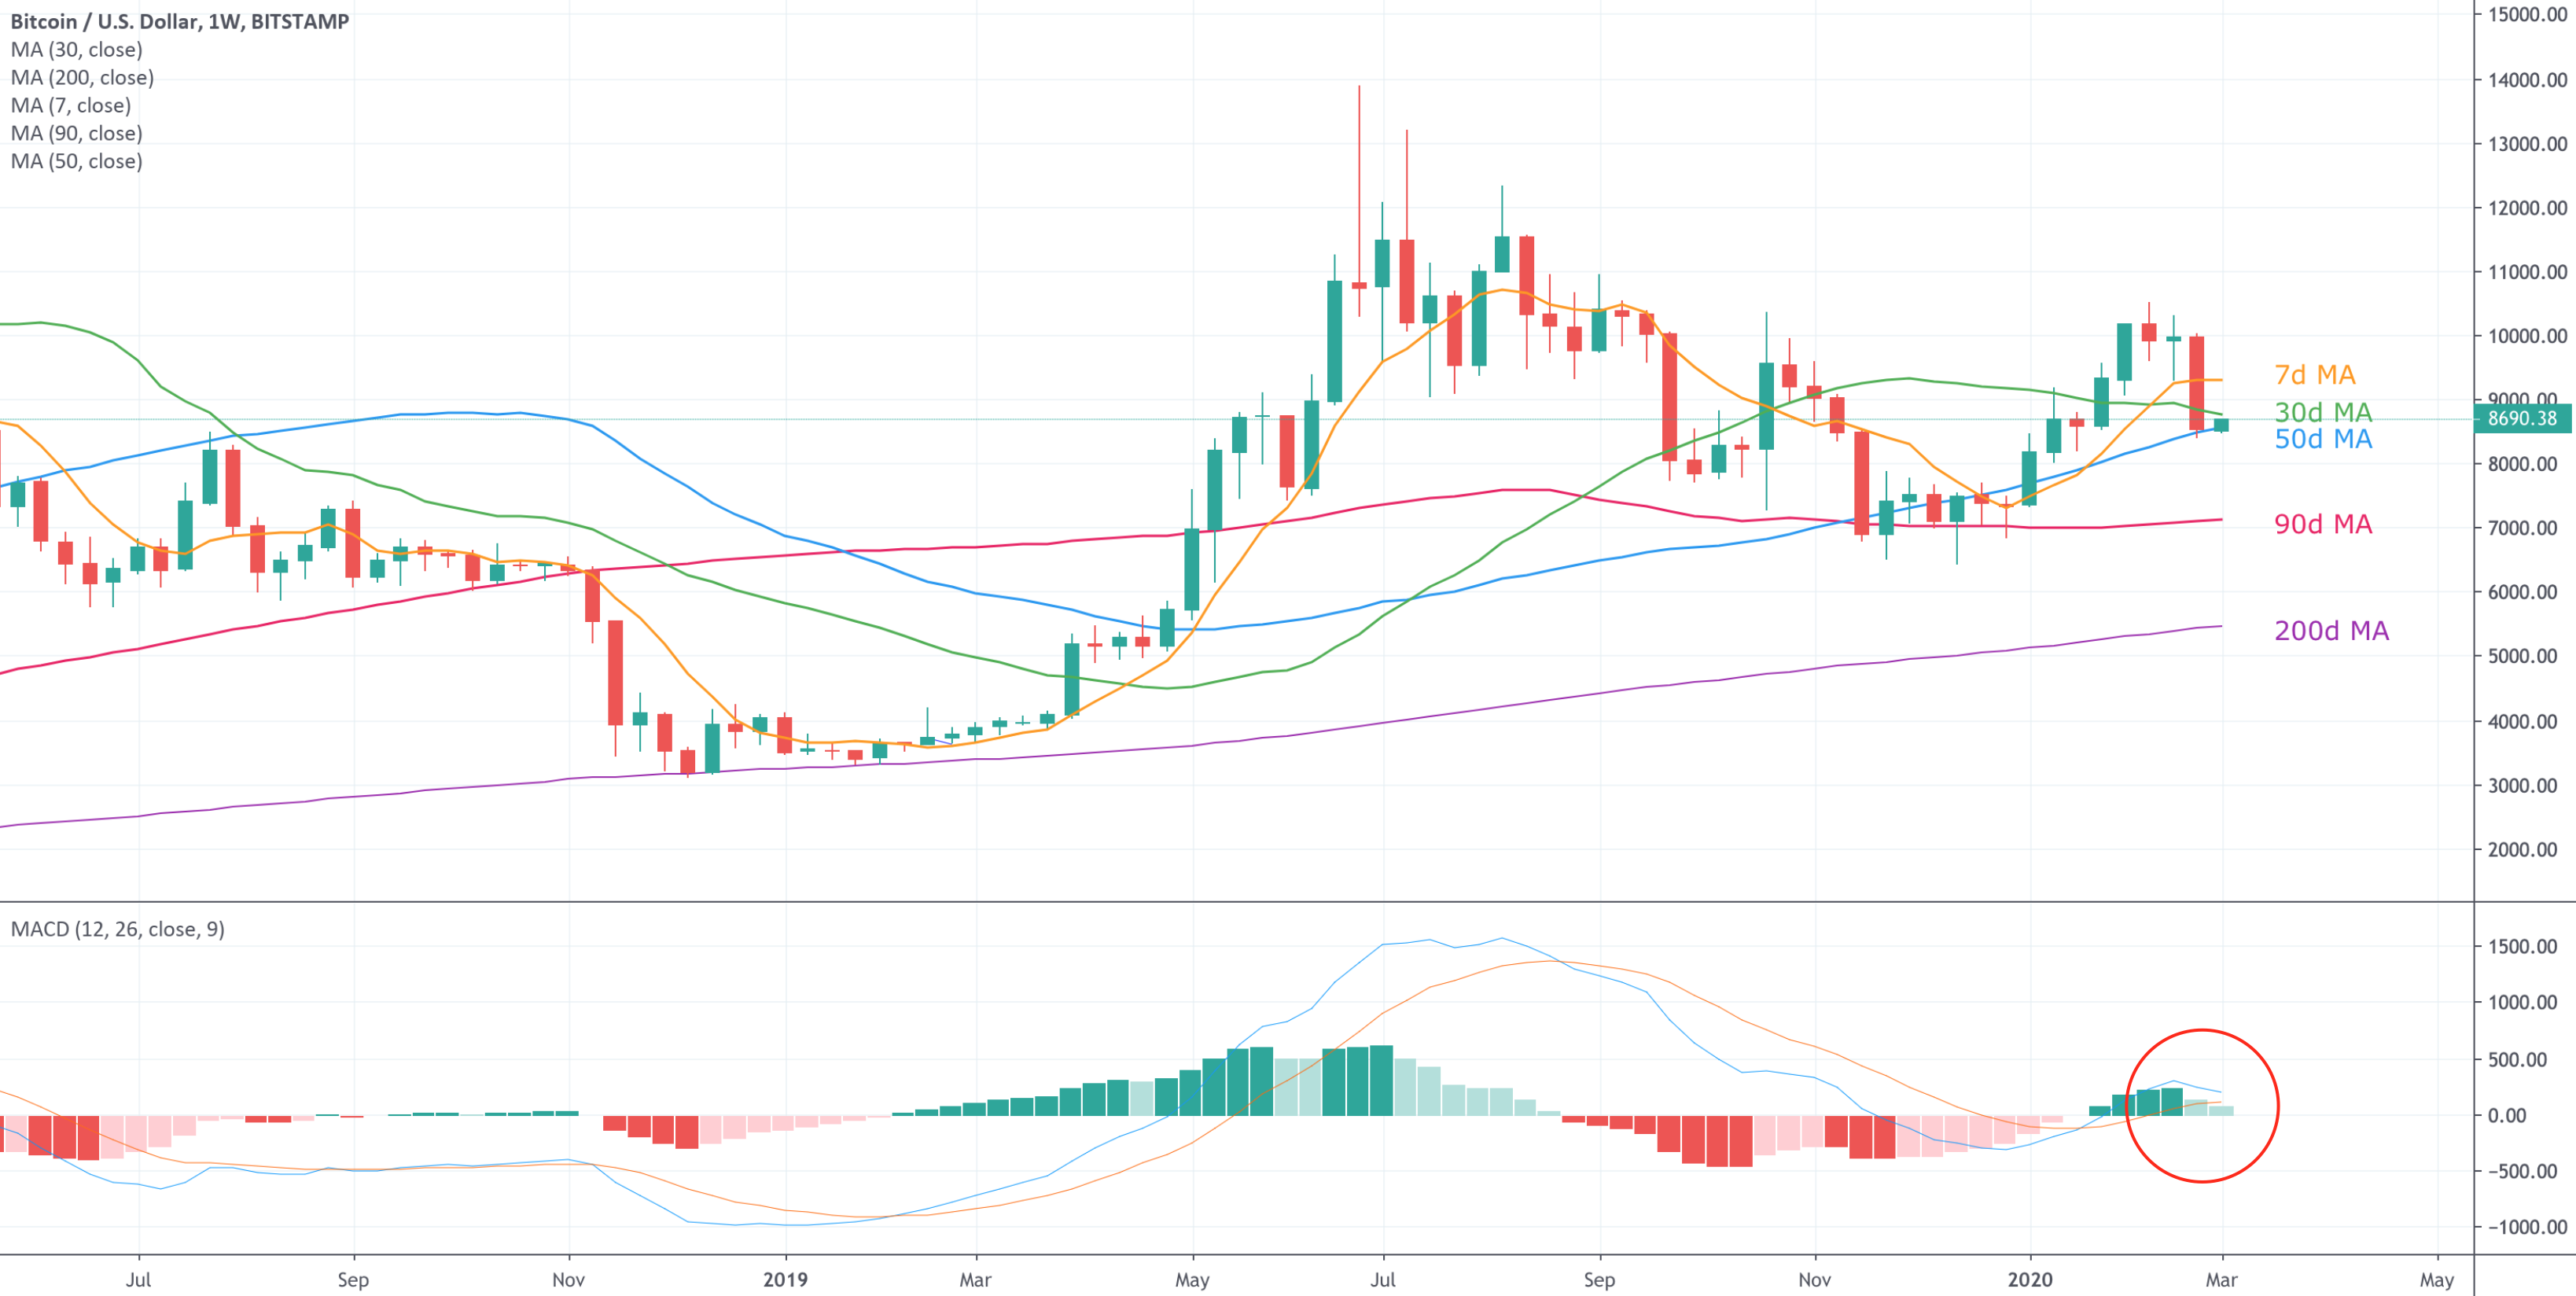
The weekly MACD for Bitcoin has fallen in the last week signifying the bears gaining strength.
Bitcoin Price Action
![](https://substackcdn.com/image/fetch/w_1456,c_limit,f_auto,q_auto:good,fl_progressive:steep/https%3A%2F%2Fbucketeer-e05bbc84-baa3-437e-9518-adb32be77984.s3.amazonaws.com%2Fpublic%2Fimages%2F907d8209-4164-4a2a-b470-9871f167dd37_1484x852.png)
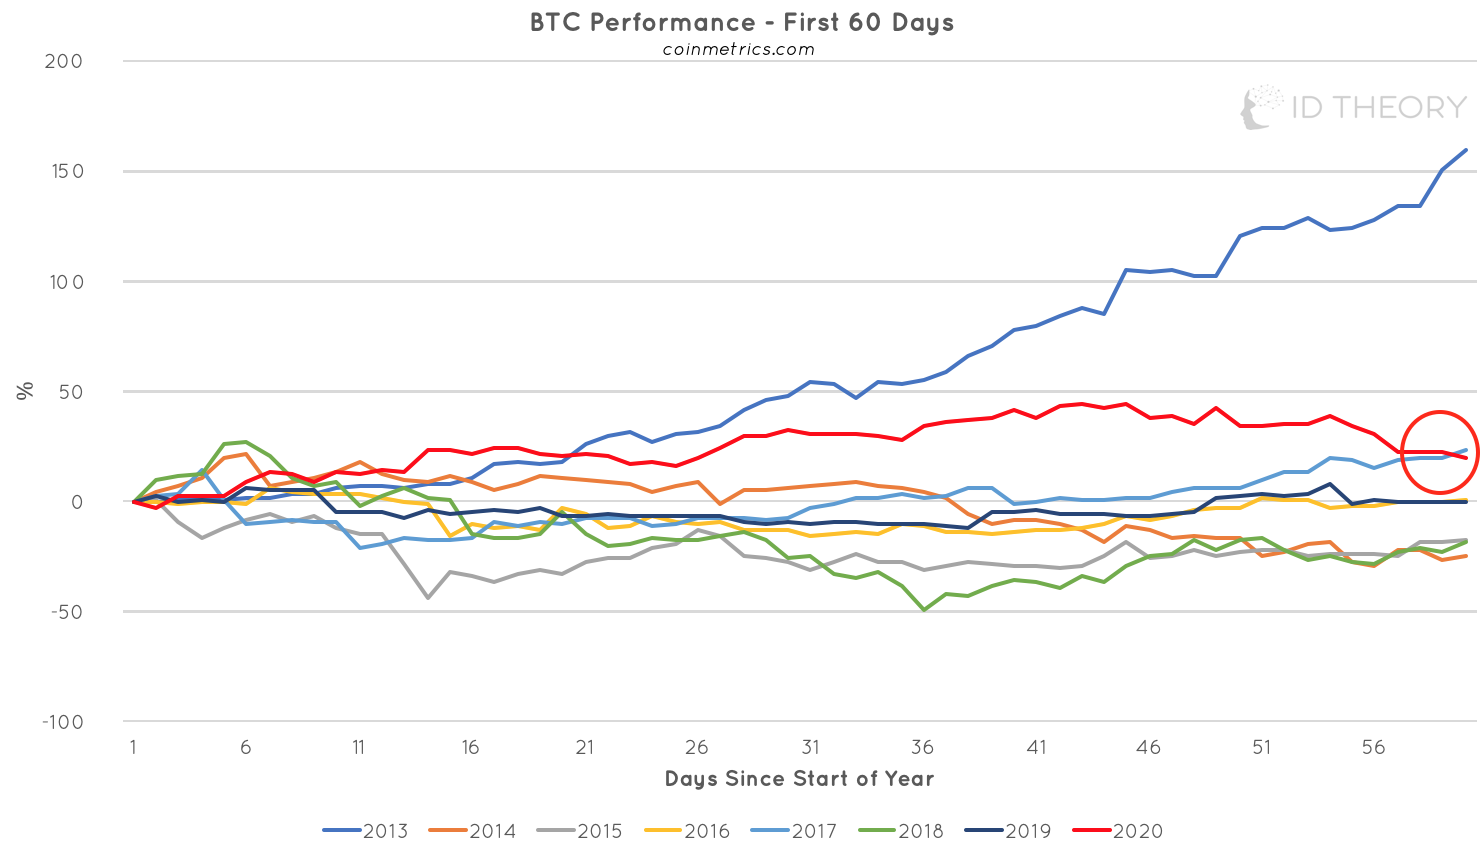
Despite having a strong start in 2020, performance this year has declined with 2020 now being the 2nd best performing start for Bitcoin after 2017 since 2013.
Bitcoin Derivative Market
The Commitment of Traders (COT) is a weekly report issued by the CFTC enumerating the holdings of participants in the Futures market. Dealer/Intermediary represents the sell side, Asset Manager/Institutional represents the buy-side.
![](https://substackcdn.com/image/fetch/w_1456,c_limit,f_auto,q_auto:good,fl_progressive:steep/https%3A%2F%2Fbucketeer-e05bbc84-baa3-437e-9518-adb32be77984.s3.amazonaws.com%2Fpublic%2Fimages%2F7d48d05b-c65b-4e11-b684-82c7baaad595_1592x886.png)
![](https://substackcdn.com/image/fetch/w_1456,c_limit,f_auto,q_auto:good,fl_progressive:steep/https%3A%2F%2Fbucketeer-e05bbc84-baa3-437e-9518-adb32be77984.s3.amazonaws.com%2Fpublic%2Fimages%2F54666212-e1a2-4160-869a-656eefcc8e12_1576x878.png)
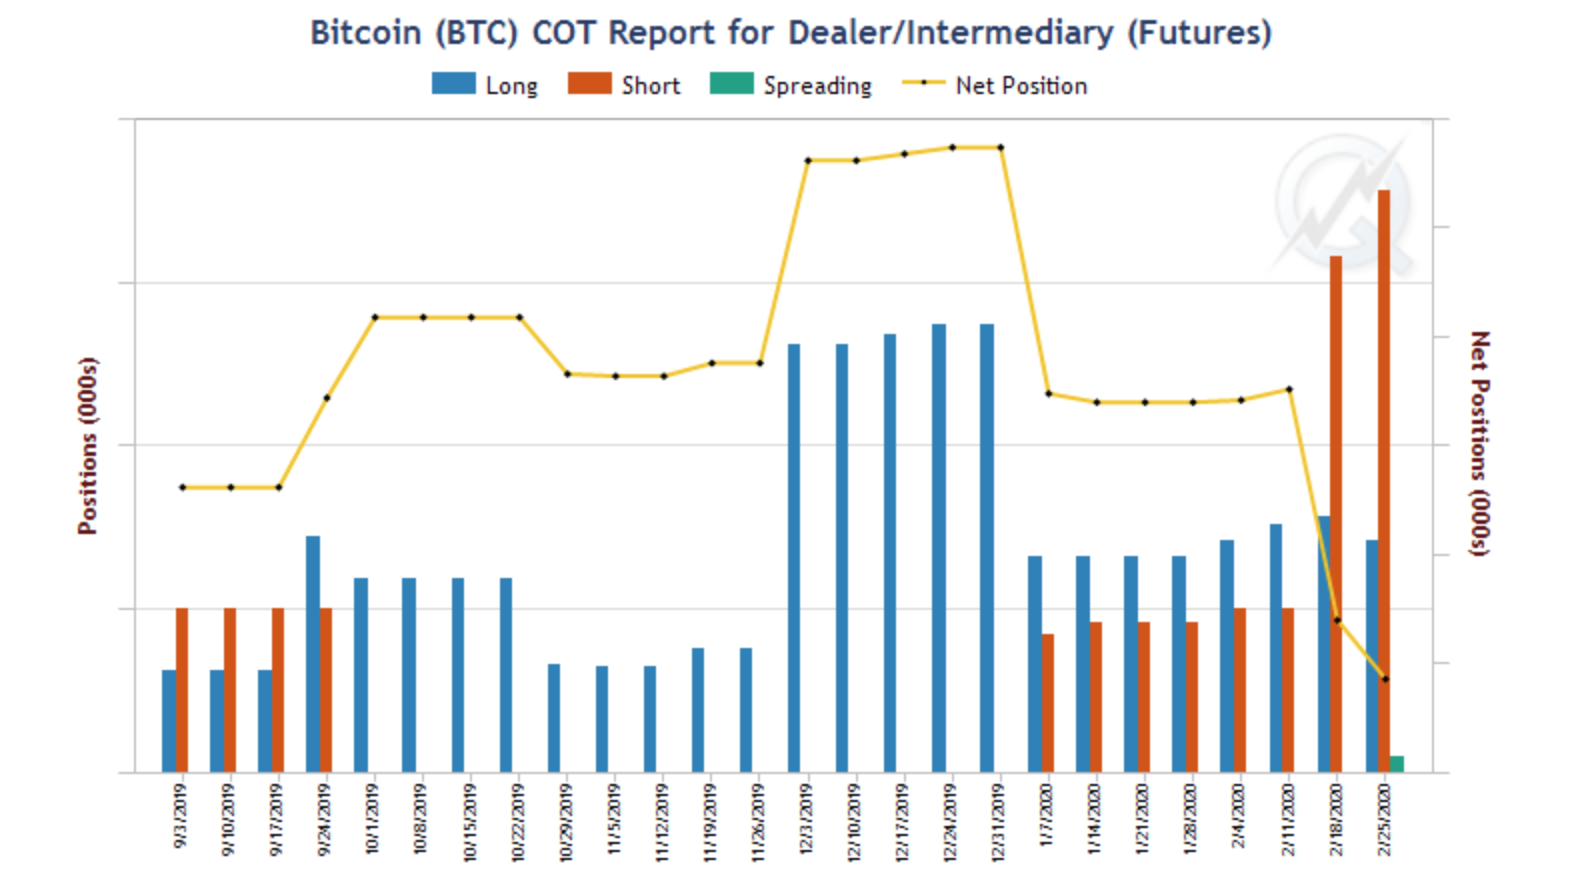
Dealer/intermediaries and asset managers continue to a take a predominantly short stance.
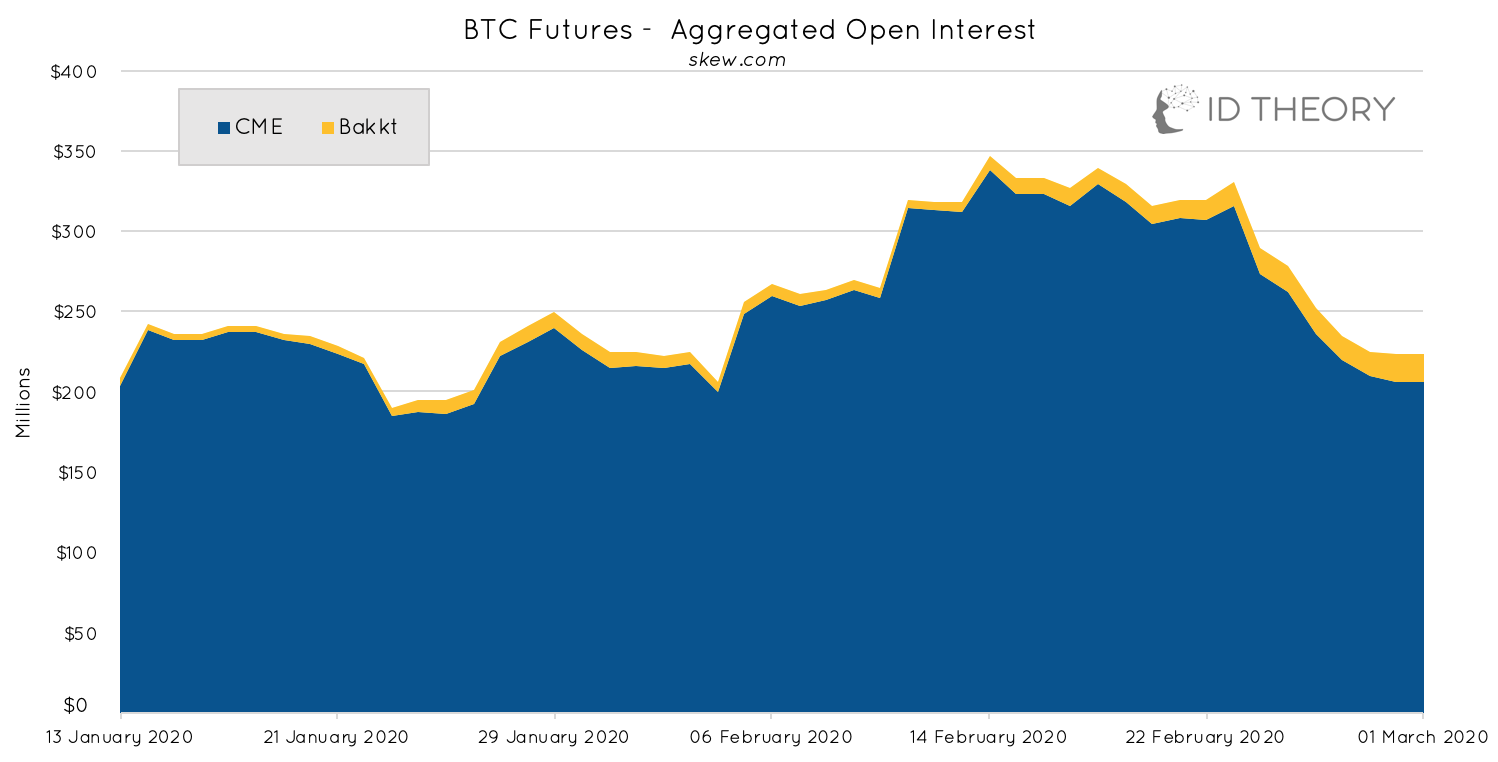
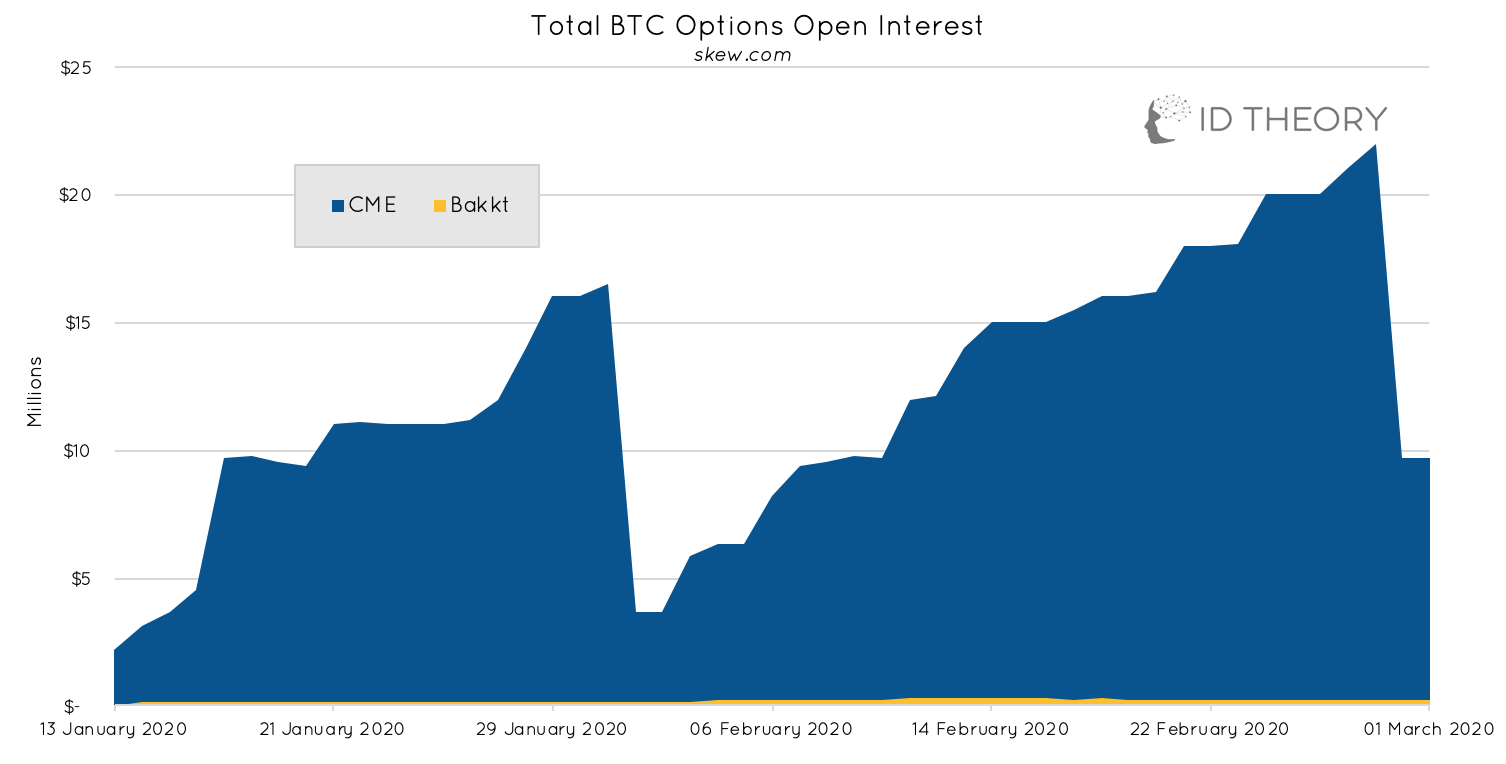
Open interest shows the USD value of open contracts offered by various platforms.
![](https://substackcdn.com/image/fetch/w_1456,c_limit,f_auto,q_auto:good,fl_progressive:steep/https%3A%2F%2Fbucketeer-e05bbc84-baa3-437e-9518-adb32be77984.s3.amazonaws.com%2Fpublic%2Fimages%2F80e75515-9321-4c88-9012-0abd7dee4263_1498x762.png)
![](https://substackcdn.com/image/fetch/w_1456,c_limit,f_auto,q_auto:good,fl_progressive:steep/https%3A%2F%2Fbucketeer-e05bbc84-baa3-437e-9518-adb32be77984.s3.amazonaws.com%2Fpublic%2Fimages%2Fb1f8ad78-8906-49b0-904b-4b483120edd9_1506x764.png)
Fundamentals
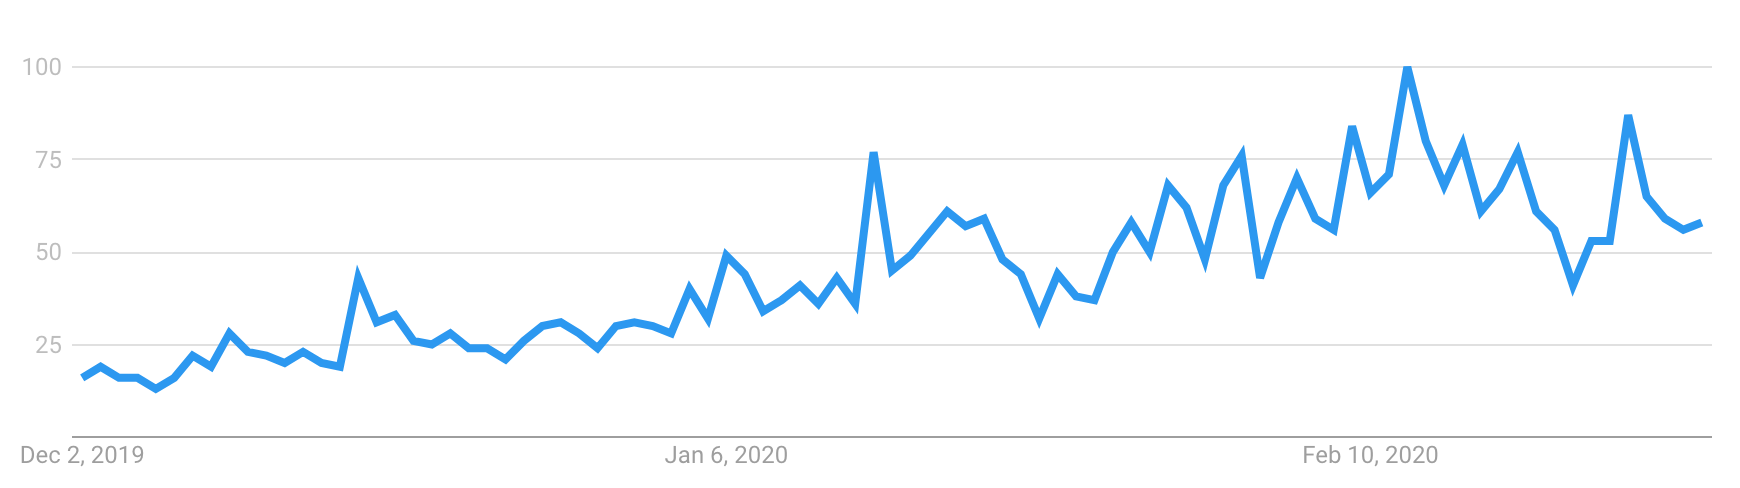
Google Trends - ‘Bitcoin’
Past 3 months - Worldwide
![](https://substackcdn.com/image/fetch/w_1456,c_limit,f_auto,q_auto:good,fl_progressive:steep/https%3A%2F%2Fbucketeer-e05bbc84-baa3-437e-9518-adb32be77984.s3.amazonaws.com%2Fpublic%2Fimages%2F553ca513-5169-478f-9338-2925a08ba943_1728x480.png)
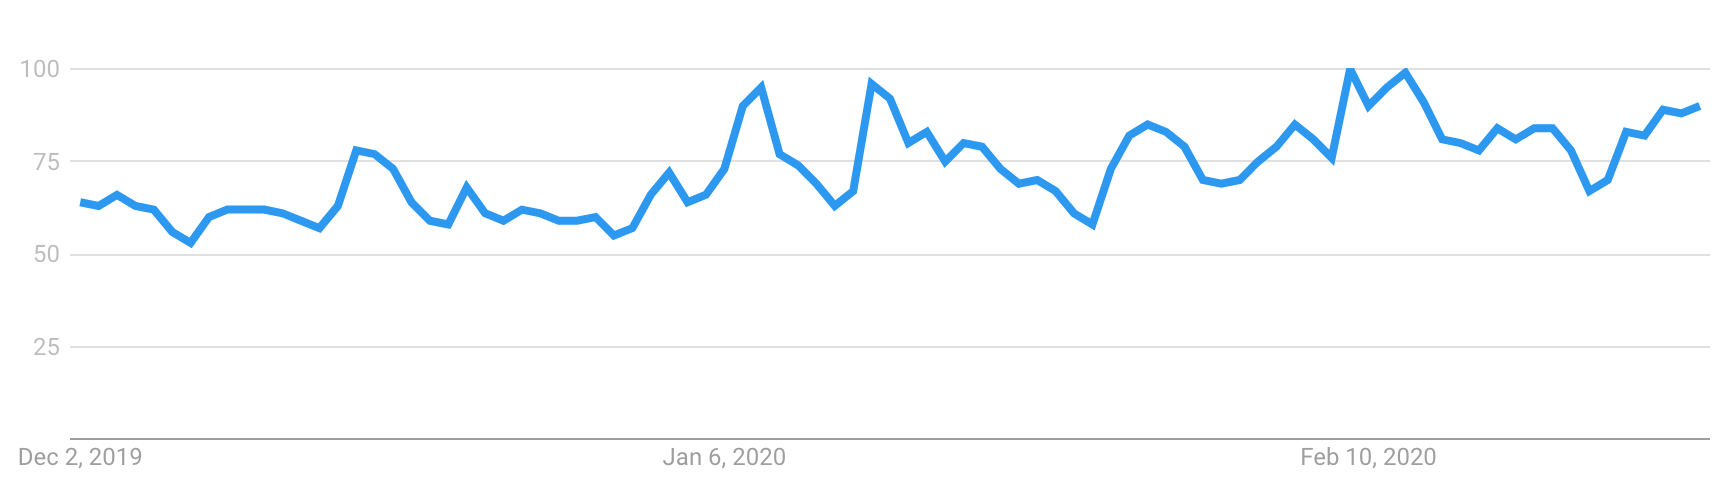
Searches for ‘bitcoin’ for the last 3 months still shows a slight trend upwards with searches currently around 90 on the search index.
Google Trends - ‘Bitcoin halving’
Past 3 months - Worldwide
![](https://substackcdn.com/image/fetch/w_1456,c_limit,f_auto,q_auto:good,fl_progressive:steep/https%3A%2F%2Fbucketeer-e05bbc84-baa3-437e-9518-adb32be77984.s3.amazonaws.com%2Fpublic%2Fimages%2Fd64154b9-3b5b-41b7-9442-2b4dc24d7cc5_1740x488.png)
Google searches for ‘bitcoin halving’ for the past 3 months still shows an overall trend upwards despite the sharp decrease seen on the 21st February.
WeChat Index - ‘Bitcoin’
![](https://substackcdn.com/image/fetch/w_1456,c_limit,f_auto,q_auto:good,fl_progressive:steep/https%3A%2F%2Fbucketeer-e05bbc84-baa3-437e-9518-adb32be77984.s3.amazonaws.com%2Fpublic%2Fimages%2F127dcdf0-2a19-4d56-ba44-c7a268c380d4_1324x886.png)
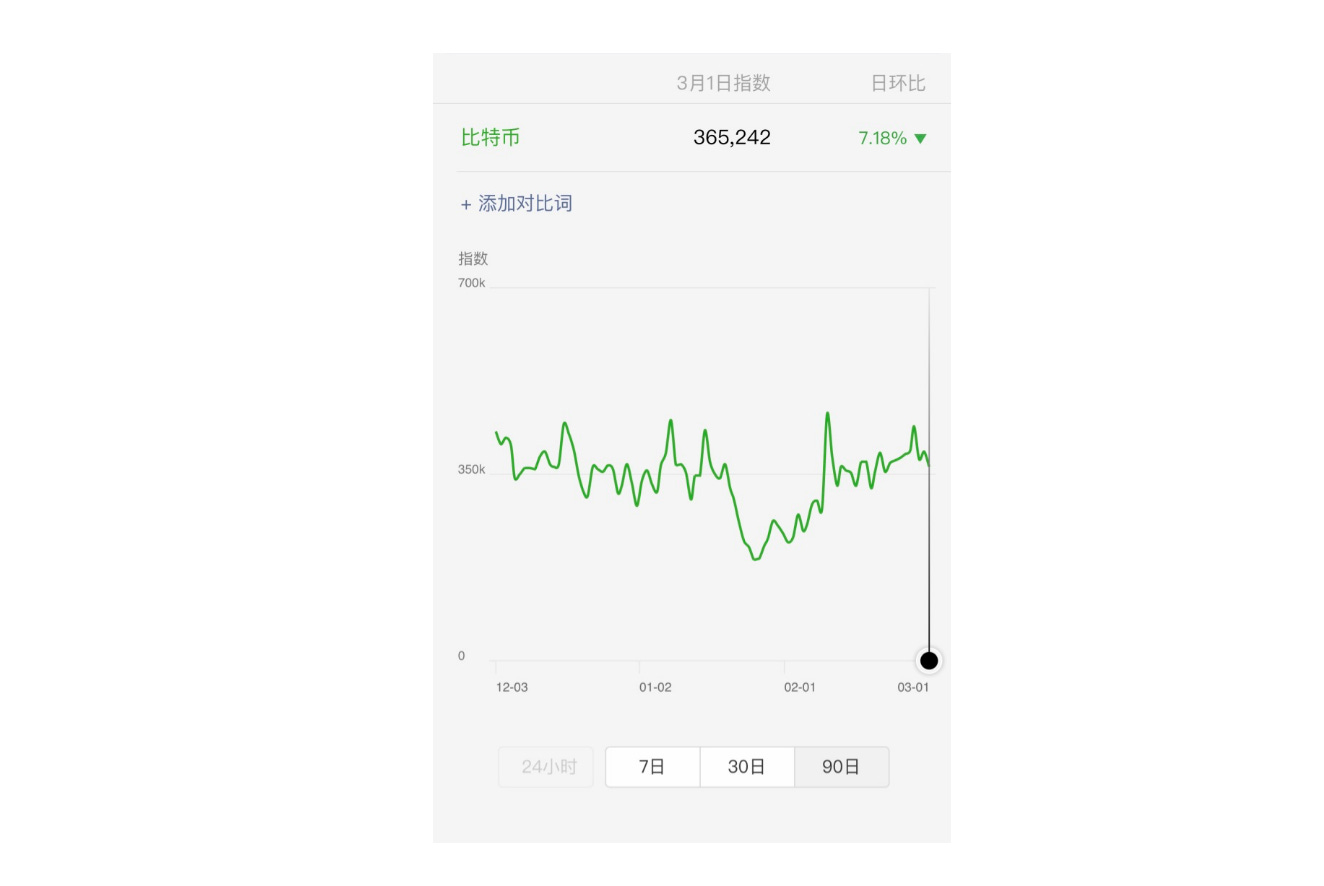
The WeChat index show that the searches for ‘bitcoin’ peaked at 440k on the 27th February but has declined slightly since then to 365k.
Localbitcoins and Paxful Volume - Global
LocalBitcoins and Paxful are both platforms that facilitate over the counter and peer-2-peer trading for bitcoin from local currencies.
![](https://substackcdn.com/image/fetch/w_1456,c_limit,f_auto,q_auto:good,fl_progressive:steep/https%3A%2F%2Fbucketeer-e05bbc84-baa3-437e-9518-adb32be77984.s3.amazonaws.com%2Fpublic%2Fimages%2Fb400c653-bc9e-48cd-92f2-45a97f8845f4_1692x812.png)
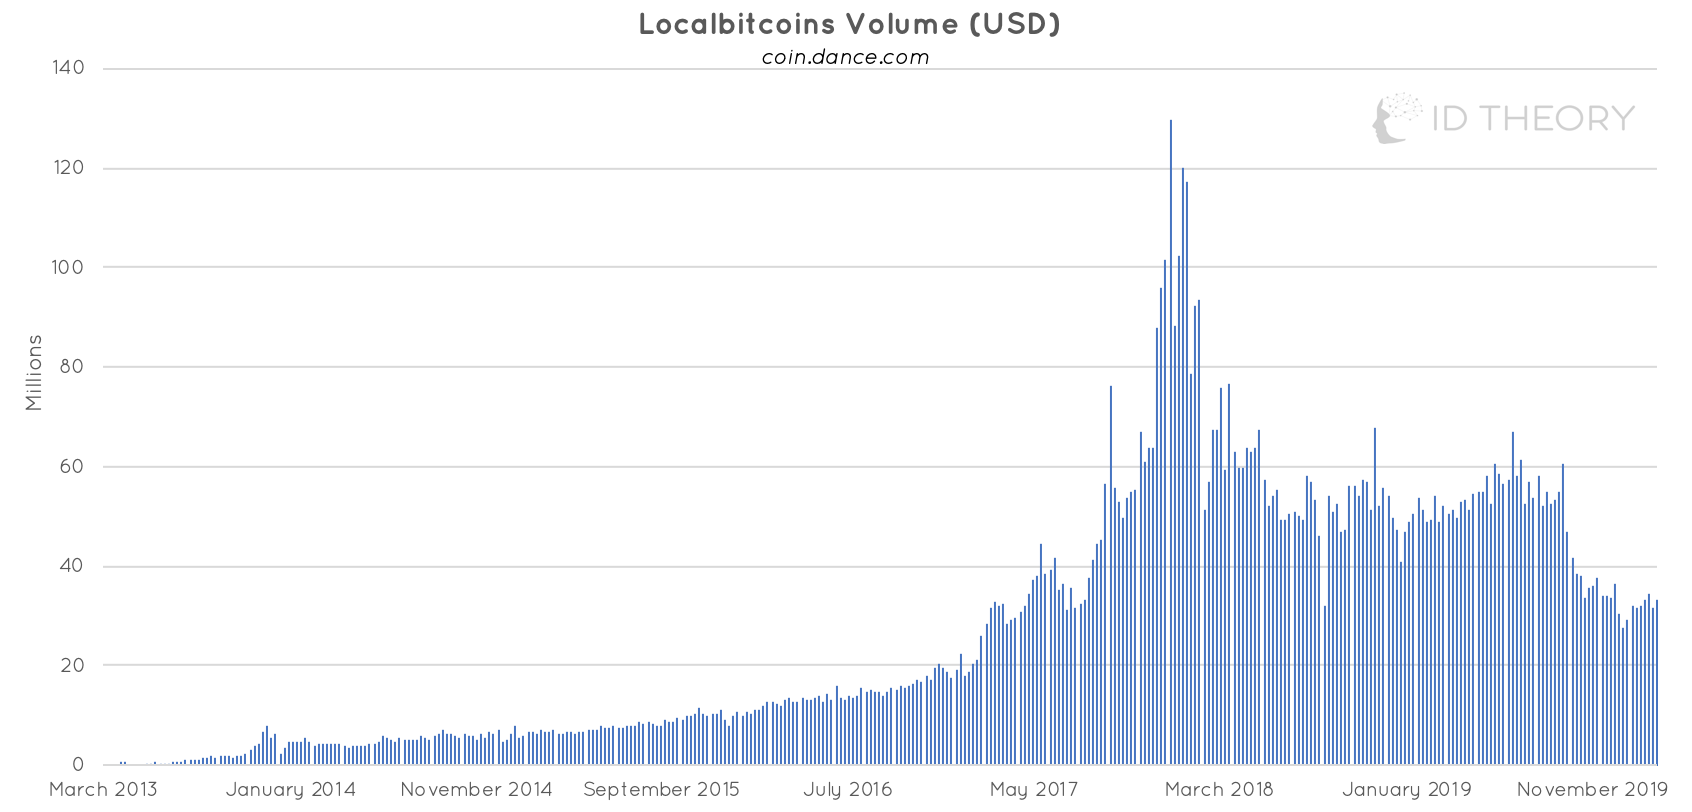
Localbitcoins saw a 5% increase in global USD volume in the last week.
![](https://substackcdn.com/image/fetch/w_1456,c_limit,f_auto,q_auto:good,fl_progressive:steep/https%3A%2F%2Fbucketeer-e05bbc84-baa3-437e-9518-adb32be77984.s3.amazonaws.com%2Fpublic%2Fimages%2F0a52f835-389e-4458-ba7d-fea95b389895_1686x812.png)
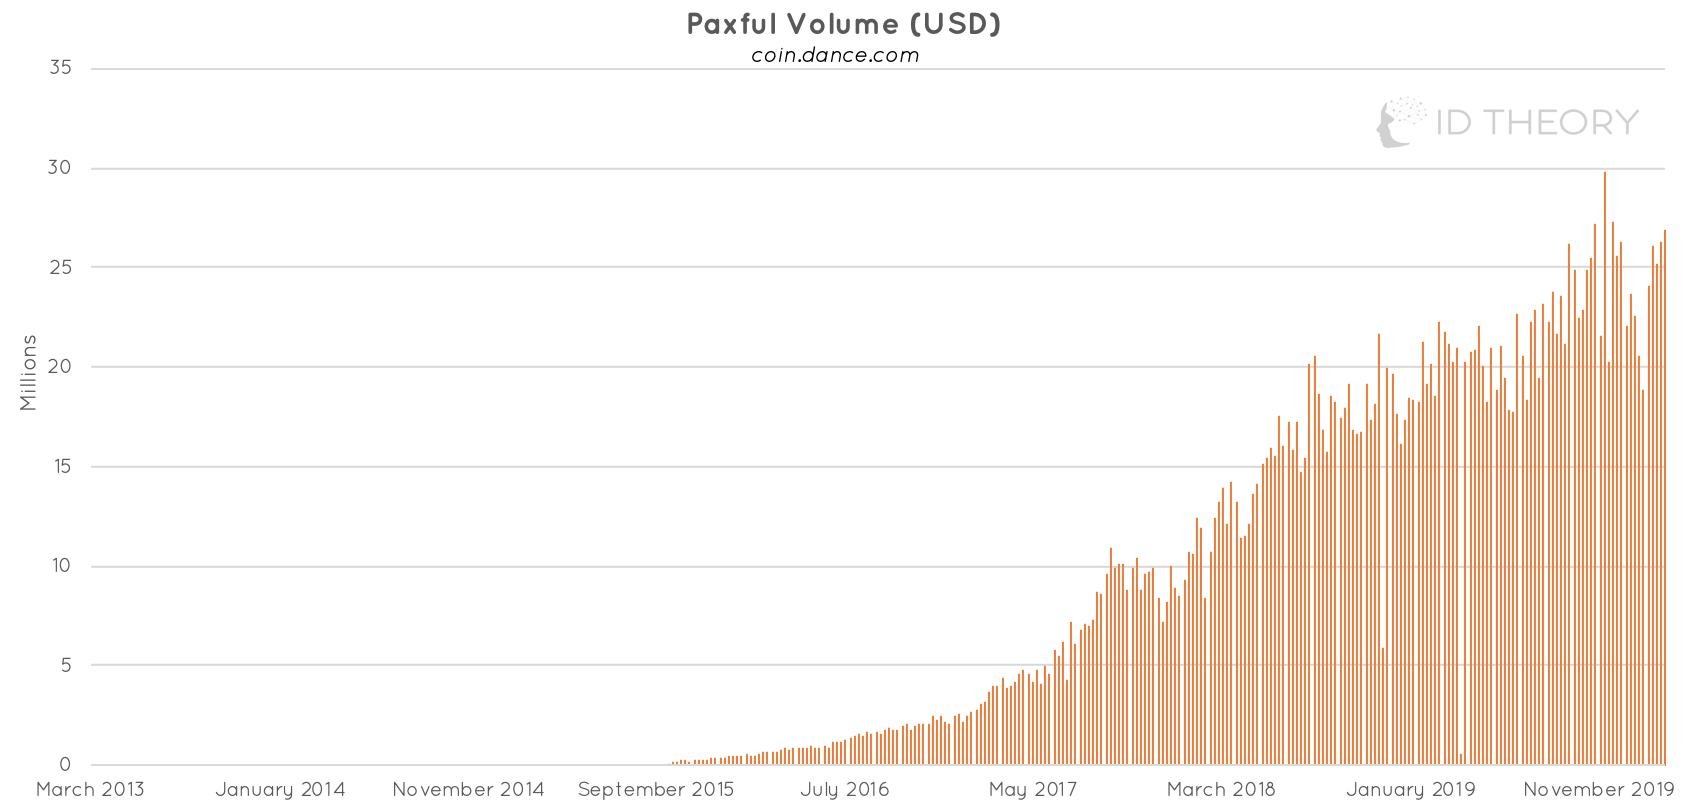
Global Paxful volume (USD) dropped 2% in the last week.
![](https://substackcdn.com/image/fetch/w_1456,c_limit,f_auto,q_auto:good,fl_progressive:steep/https%3A%2F%2Fbucketeer-e05bbc84-baa3-437e-9518-adb32be77984.s3.amazonaws.com%2Fpublic%2Fimages%2Fe9d037cf-a9ed-450a-a1e4-093a852e6daa_1712x822.png)
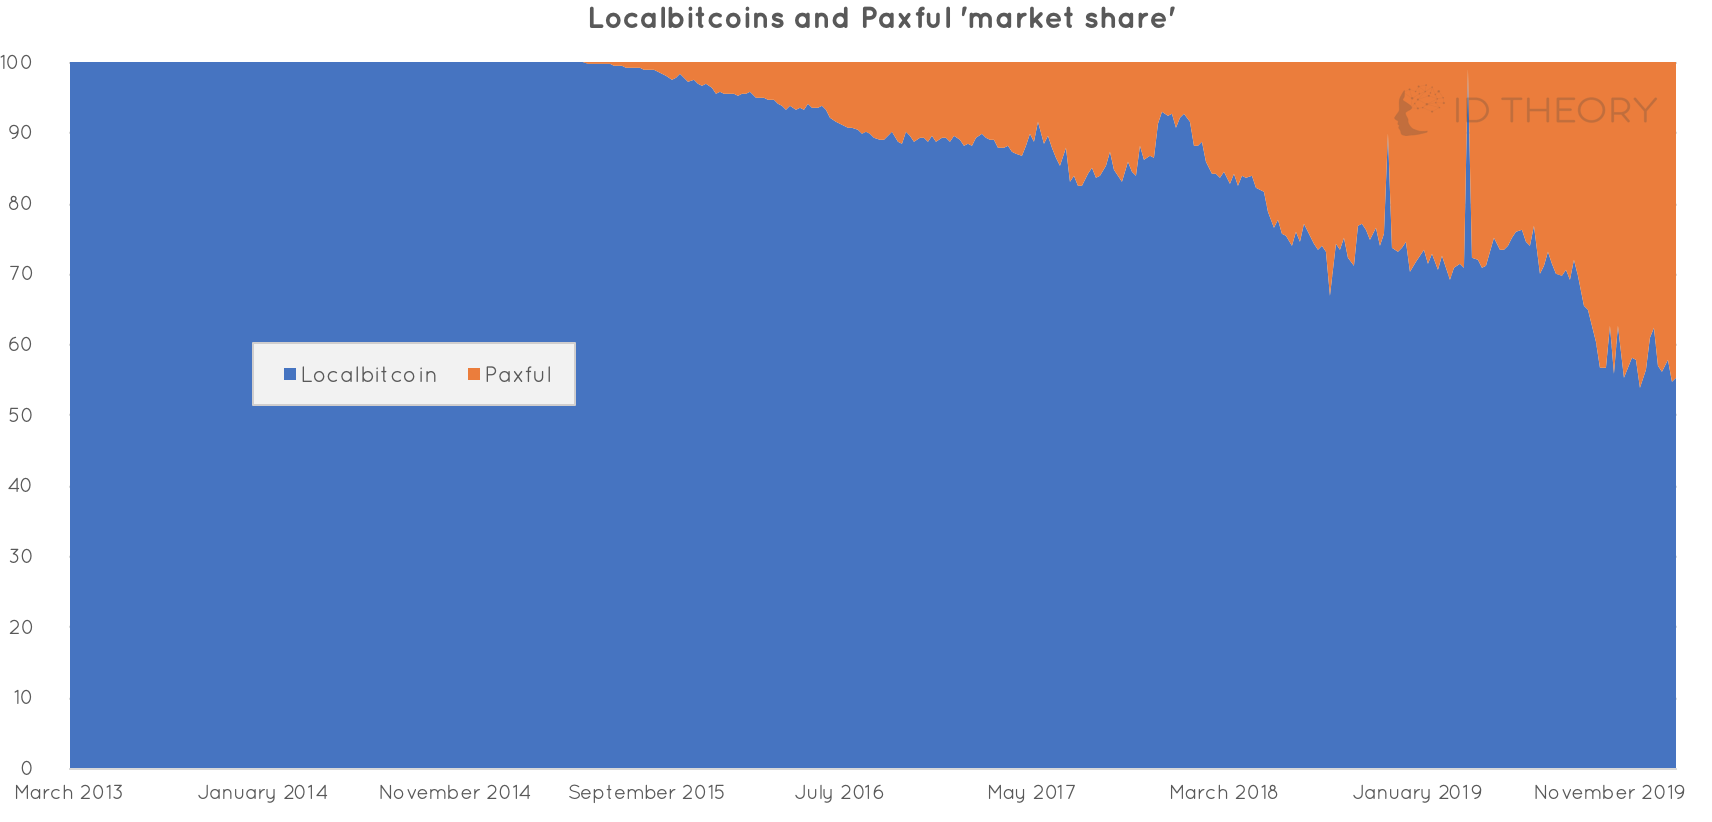
Localbitcoins has ~55% of the USD denominated volume market share over Paxful.
Confirmed Transactions Per Day
![](https://substackcdn.com/image/fetch/w_1456,c_limit,f_auto,q_auto:good,fl_progressive:steep/https%3A%2F%2Fbucketeer-e05bbc84-baa3-437e-9518-adb32be77984.s3.amazonaws.com%2Fpublic%2Fimages%2Fd919d33f-c47a-4809-adcb-0547a65448f5_1464x710.png)
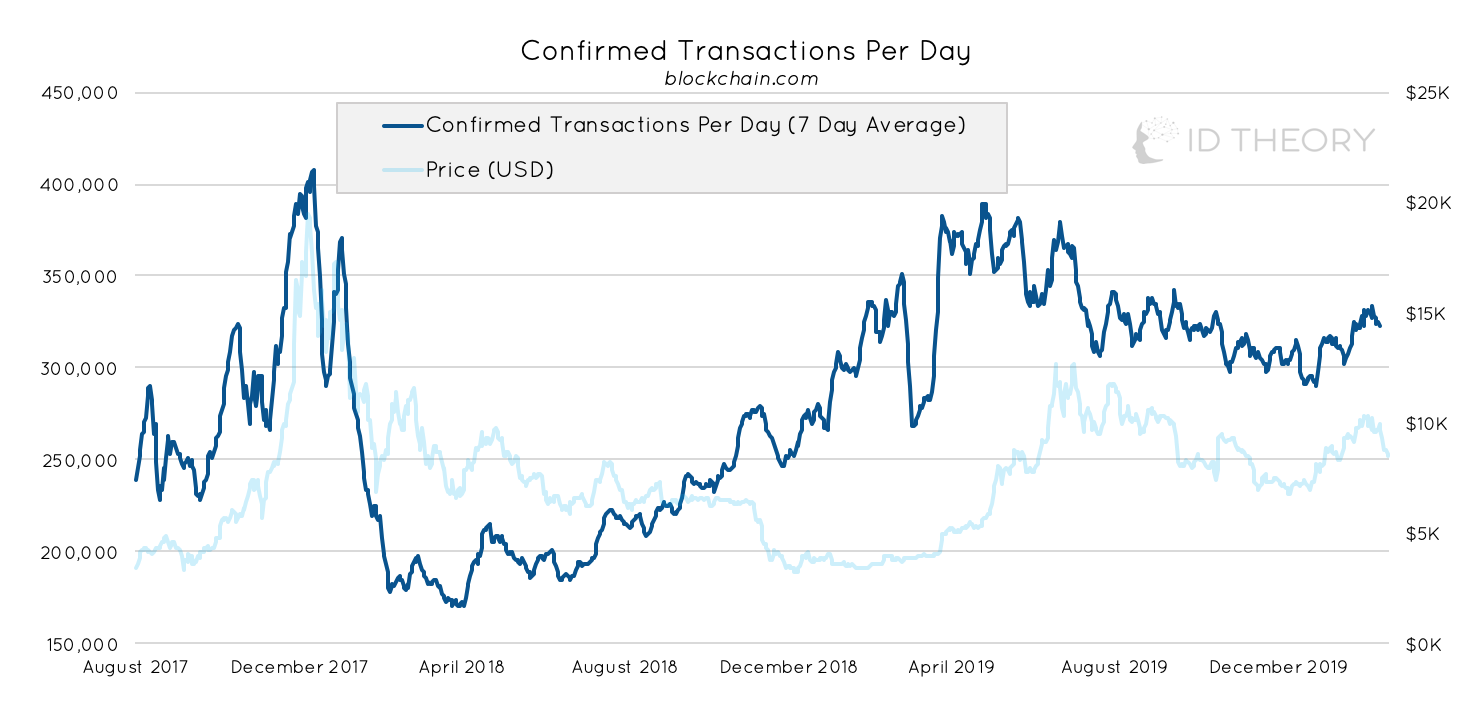
Confirmed transactions are up 2% since last week and up 11% YTD.
Mean Transaction Value
![](https://substackcdn.com/image/fetch/w_1456,c_limit,f_auto,q_auto:good,fl_progressive:steep/https%3A%2F%2Fbucketeer-e05bbc84-baa3-437e-9518-adb32be77984.s3.amazonaws.com%2Fpublic%2Fimages%2F06a05b4b-1c2c-4cd3-8059-ade4bbb936a1_1488x706.png)
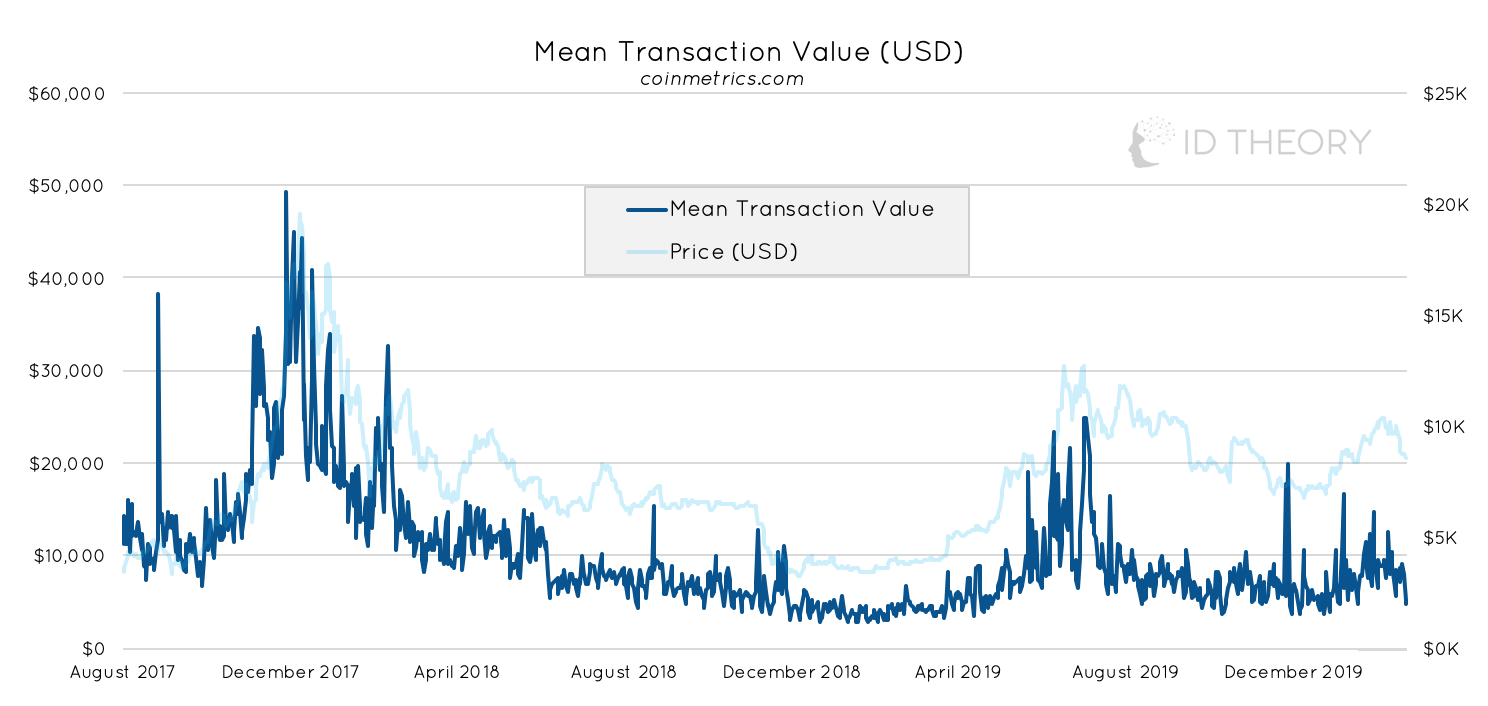
The mean transaction value has decreased 44% for the week and is up 27% YTD.
Bitcoin Economic Throughput
![](https://substackcdn.com/image/fetch/w_1456,c_limit,f_auto,q_auto:good,fl_progressive:steep/https%3A%2F%2Fbucketeer-e05bbc84-baa3-437e-9518-adb32be77984.s3.amazonaws.com%2Fpublic%2Fimages%2Fcc291fa7-3743-479a-860f-da91c63bad54_1452x692.png)
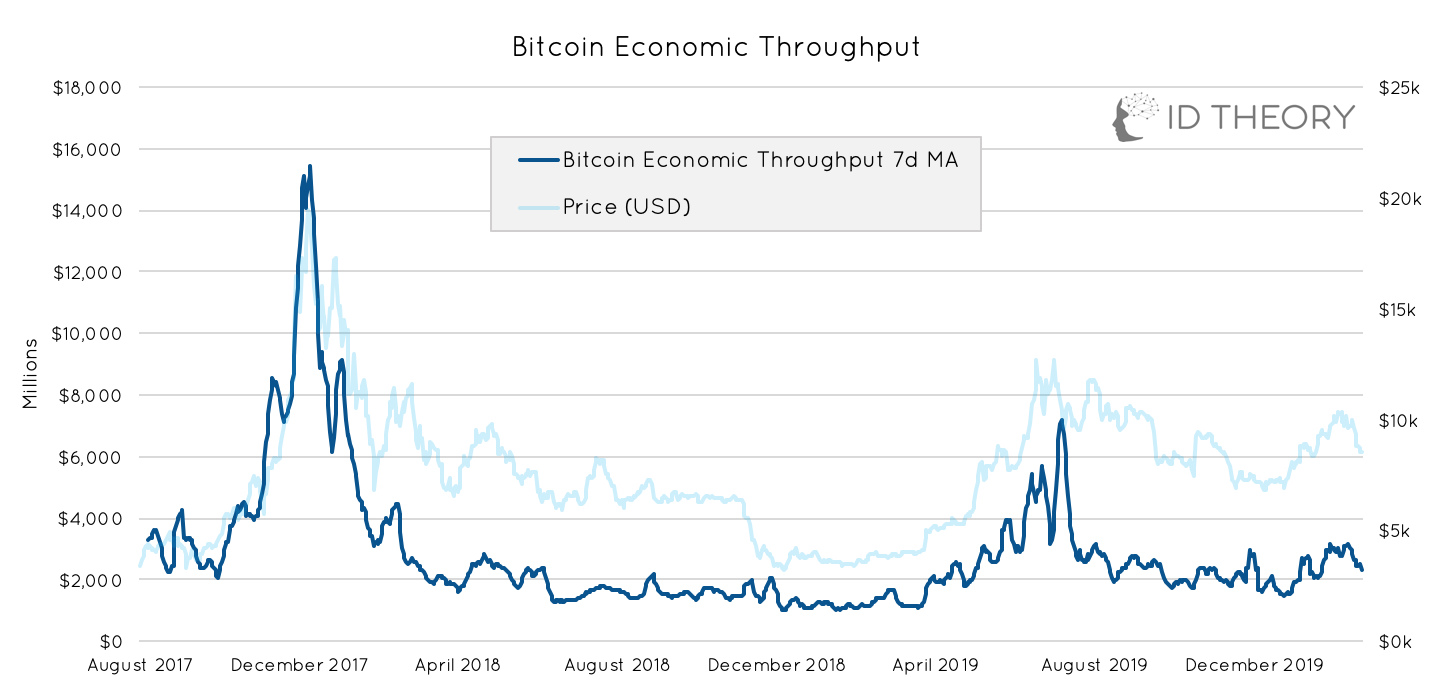
Current economic throughput is down 19% since last week hovering around $2.85Bn USD but is up 59% YTD on the 7d MA (moving average).
Hashrate
![](https://substackcdn.com/image/fetch/w_1456,c_limit,f_auto,q_auto:good,fl_progressive:steep/https%3A%2F%2Fbucketeer-e05bbc84-baa3-437e-9518-adb32be77984.s3.amazonaws.com%2Fpublic%2Fimages%2Fb9fc63ff-1104-4265-8b23-26231c553097_1512x698.png)
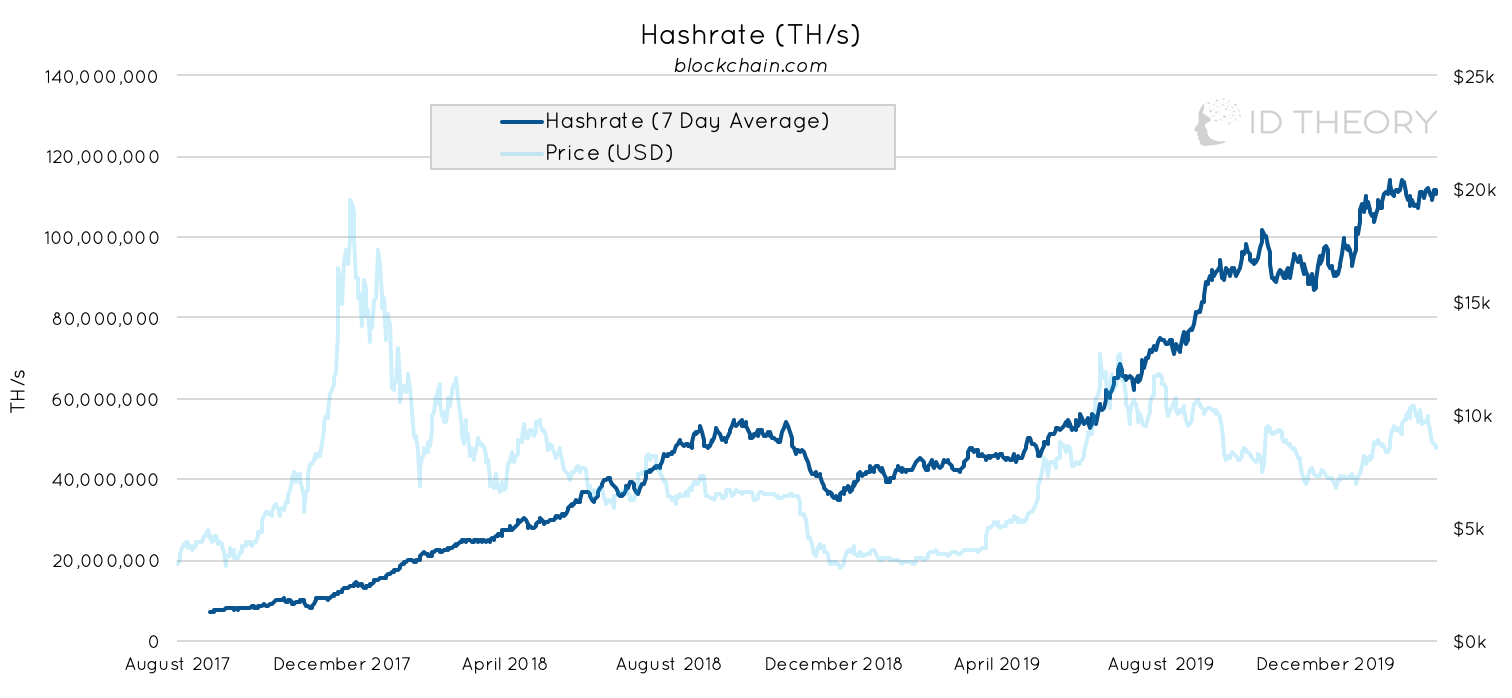
Bitcoin hashrate (7 day moving average) is down 1% for the week. Hashrate is up 14% YTD. Currently at 111m TH/s on the 7 day moving average.
Daily Active Addresses
![](https://substackcdn.com/image/fetch/w_1456,c_limit,f_auto,q_auto:good,fl_progressive:steep/https%3A%2F%2Fbucketeer-e05bbc84-baa3-437e-9518-adb32be77984.s3.amazonaws.com%2Fpublic%2Fimages%2F46293e2f-0ac0-4635-9447-60a23960003c_1458x700.png)
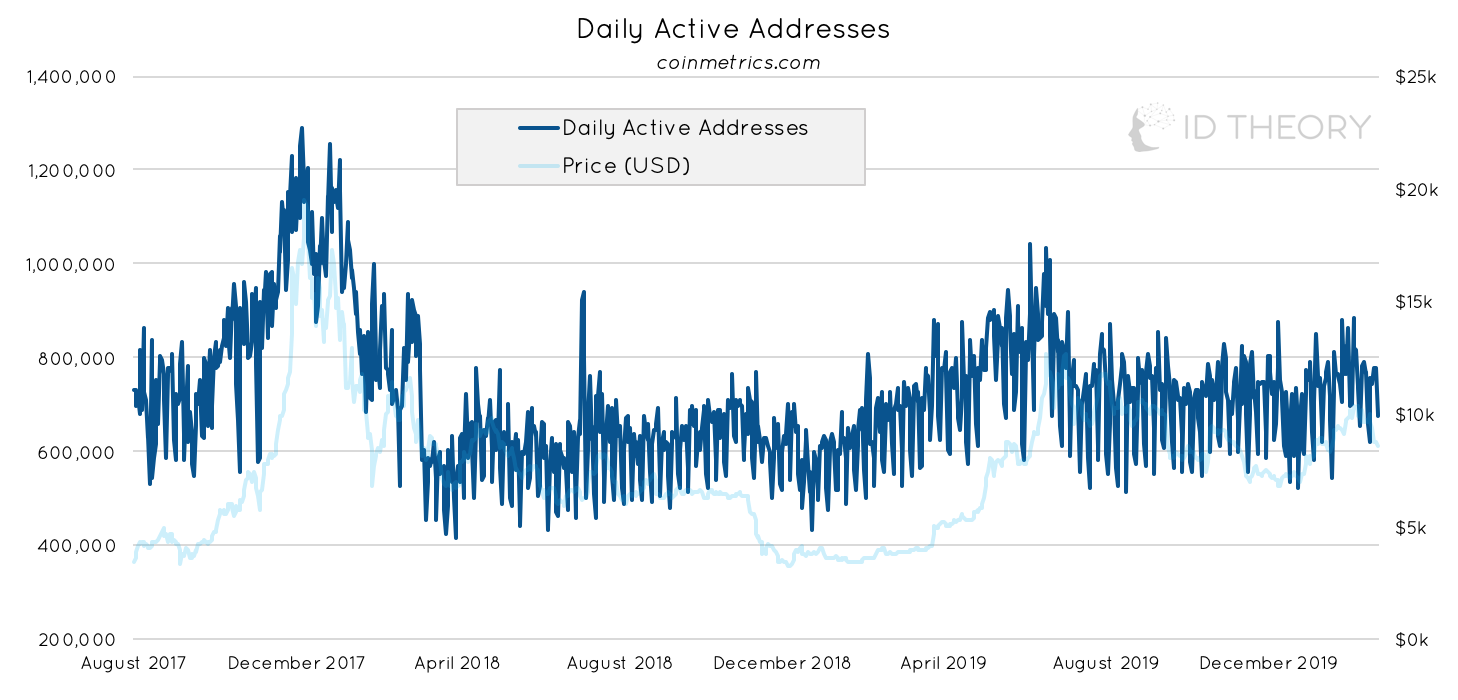
The daily active addresses count for Bitcoin is up 8% from the last week. Active address count is still up 29% YTD.
Bitcoin Days Destroyed
![](https://substackcdn.com/image/fetch/w_1456,c_limit,f_auto,q_auto:good,fl_progressive:steep/https%3A%2F%2Fbucketeer-e05bbc84-baa3-437e-9518-adb32be77984.s3.amazonaws.com%2Fpublic%2Fimages%2F43f44382-b852-4c76-84f0-f8a1f8f5caf5_1428x698.png)
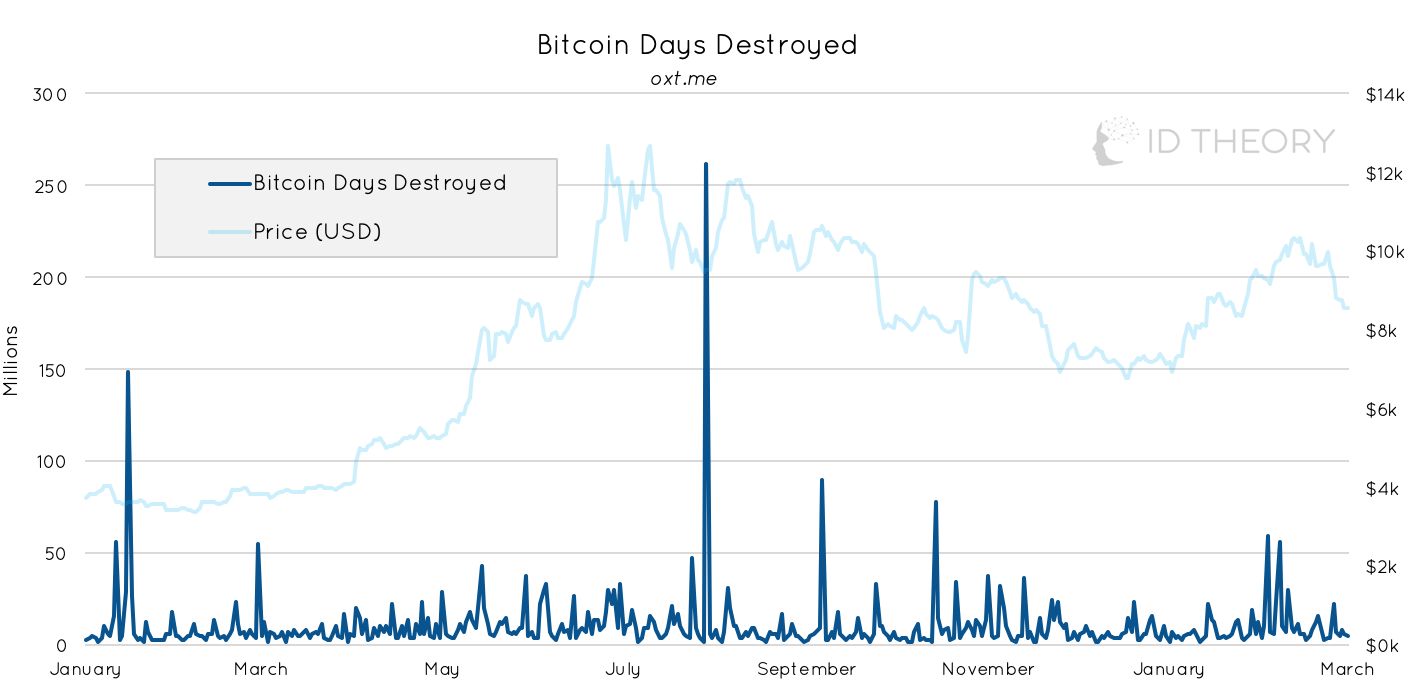
During the last week there has not been any significant BDD activity observed.
Realised Cap
![](https://substackcdn.com/image/fetch/w_1456,c_limit,f_auto,q_auto:good,fl_progressive:steep/https%3A%2F%2Fbucketeer-e05bbc84-baa3-437e-9518-adb32be77984.s3.amazonaws.com%2Fpublic%2Fimages%2Ff66296c3-3770-4143-bb6e-d74ec5b6c07e_1510x790.png)
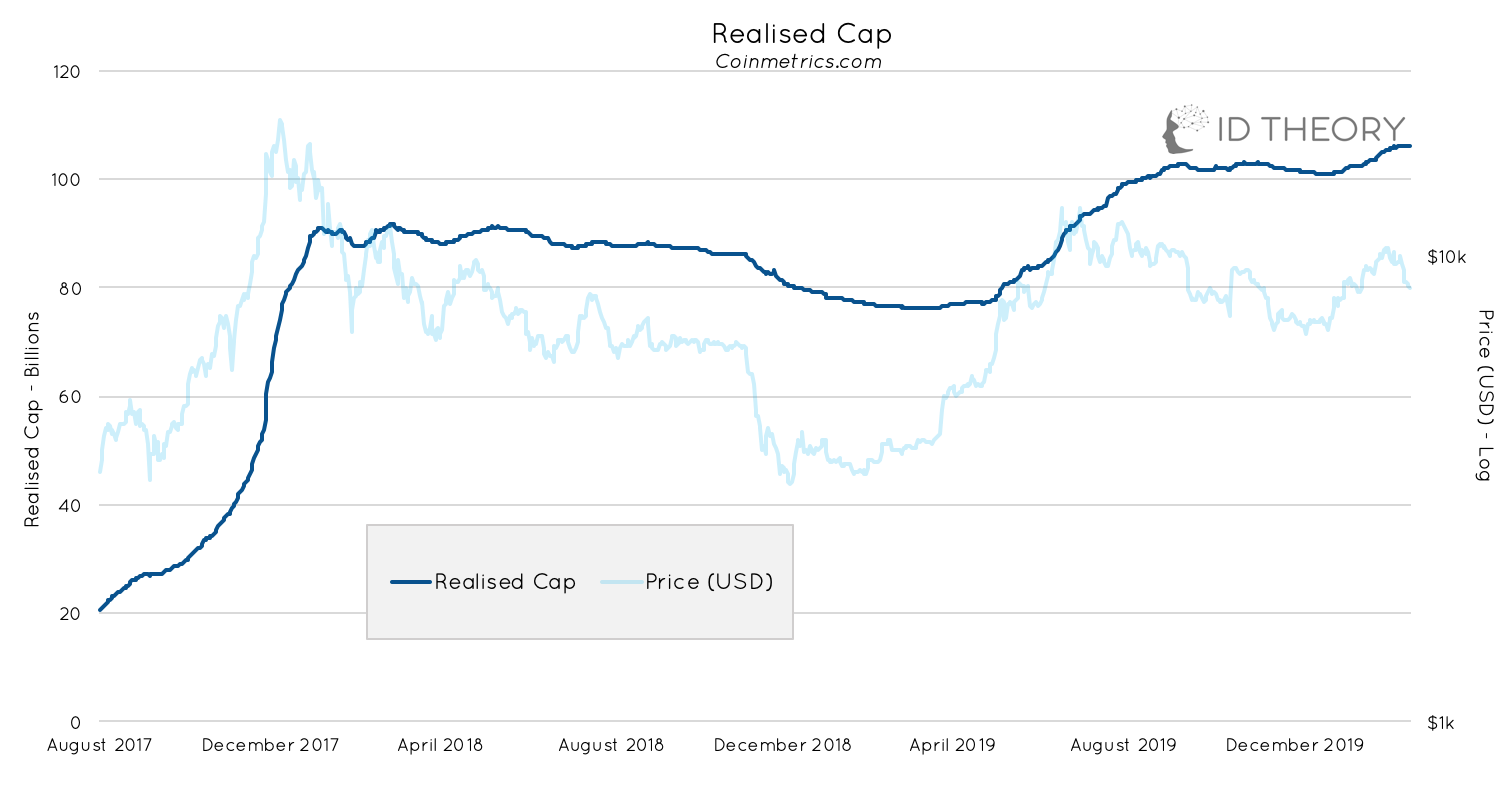
Realised Cap is currently standing at ~$106 Bn.
MVRV
![](https://substackcdn.com/image/fetch/w_1456,c_limit,f_auto,q_auto:good,fl_progressive:steep/https%3A%2F%2Fbucketeer-e05bbc84-baa3-437e-9518-adb32be77984.s3.amazonaws.com%2Fpublic%2Fimages%2F30ec5d35-acb1-4c83-a805-ec220c43d54a_1490x700.png)
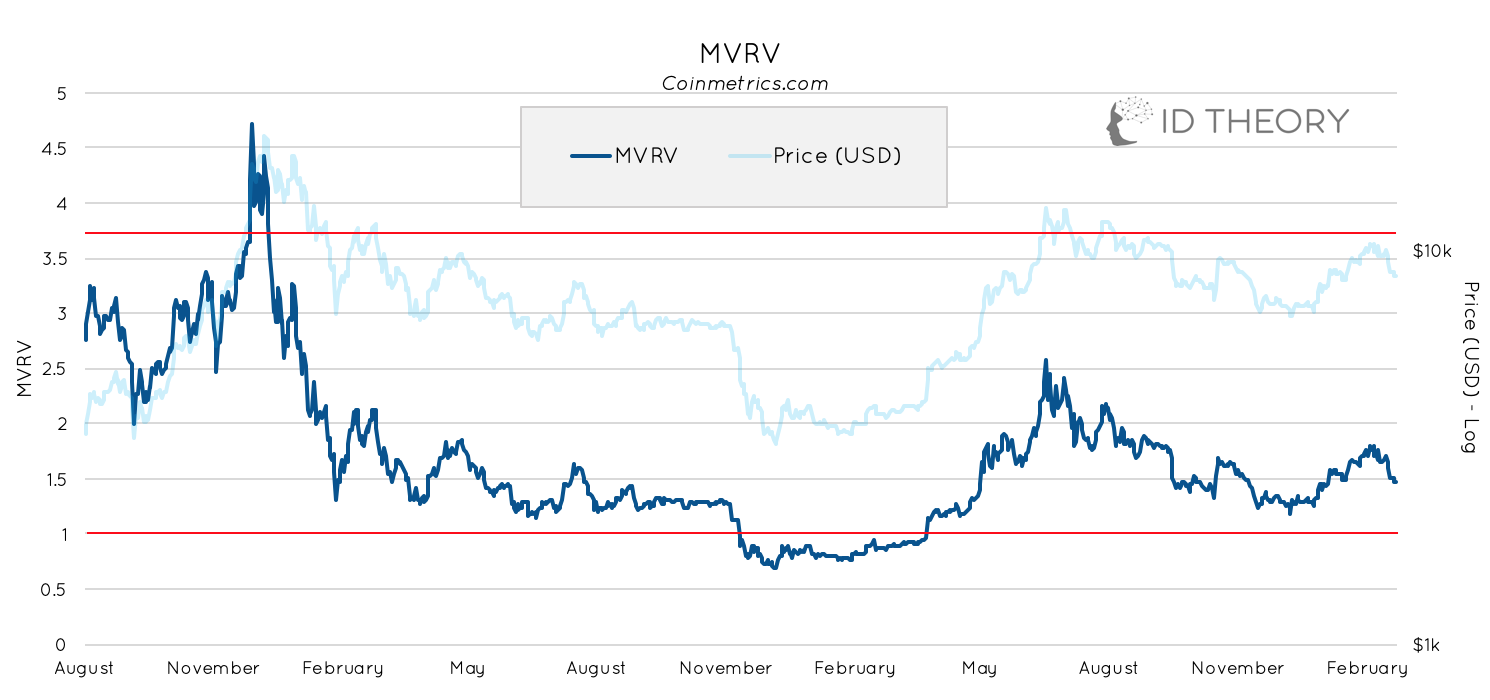
Historically, two important thresholds can be observed - MVRV above 3.7 could signal potential overvaluation and MVRV below 1 could signal undervaluation. The ratio ratio is currently at ~1.47.
Lightning Nodes
![](https://substackcdn.com/image/fetch/w_1456,c_limit,f_auto,q_auto:good,fl_progressive:steep/https%3A%2F%2Fbucketeer-e05bbc84-baa3-437e-9518-adb32be77984.s3.amazonaws.com%2Fpublic%2Fimages%2F576616f9-a129-4019-8794-200aa0d4410b_1392x694.png)
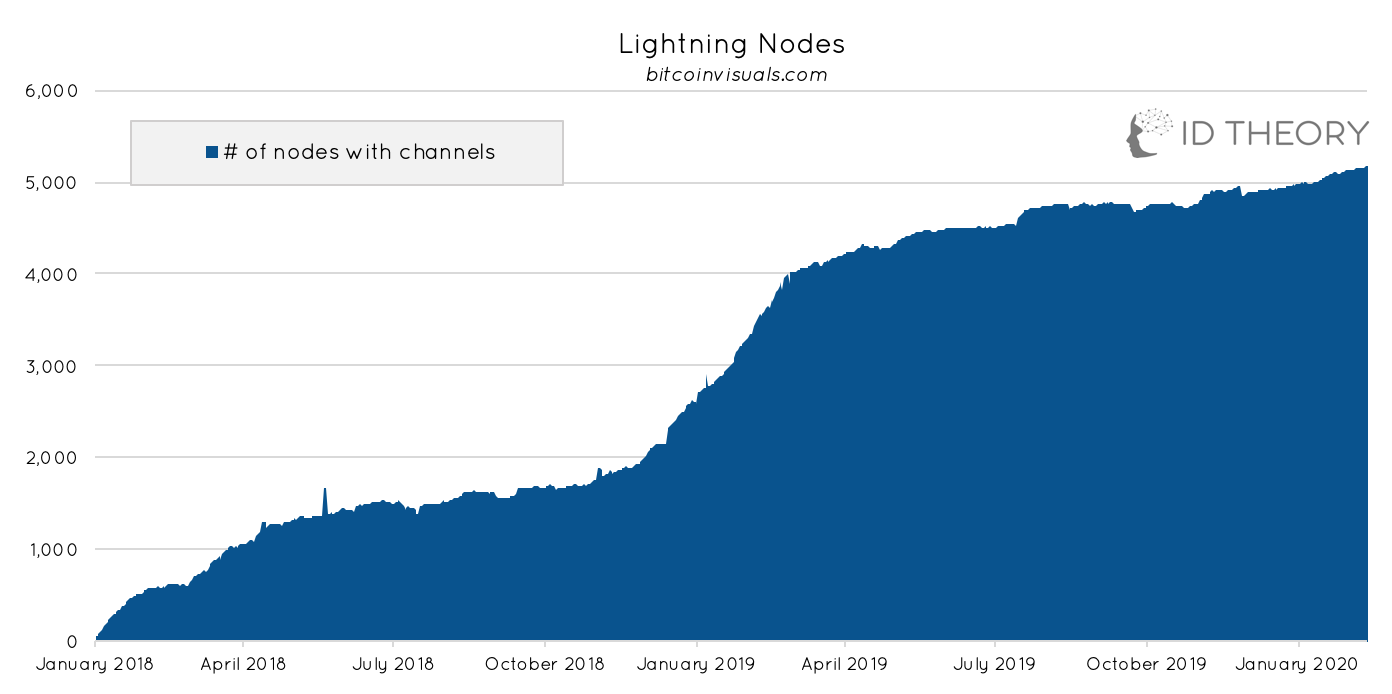
The number of unique lightning nodes on the Bitcoin network is up 1% for the week. The number of nodes is up 5% YTD.
Lightning Channels
![](https://substackcdn.com/image/fetch/w_1456,c_limit,f_auto,q_auto:good,fl_progressive:steep/https%3A%2F%2Fbucketeer-e05bbc84-baa3-437e-9518-adb32be77984.s3.amazonaws.com%2Fpublic%2Fimages%2F2a7b966c-c6fc-4f16-8d9e-0ef83d31b05c_1414x690.png)
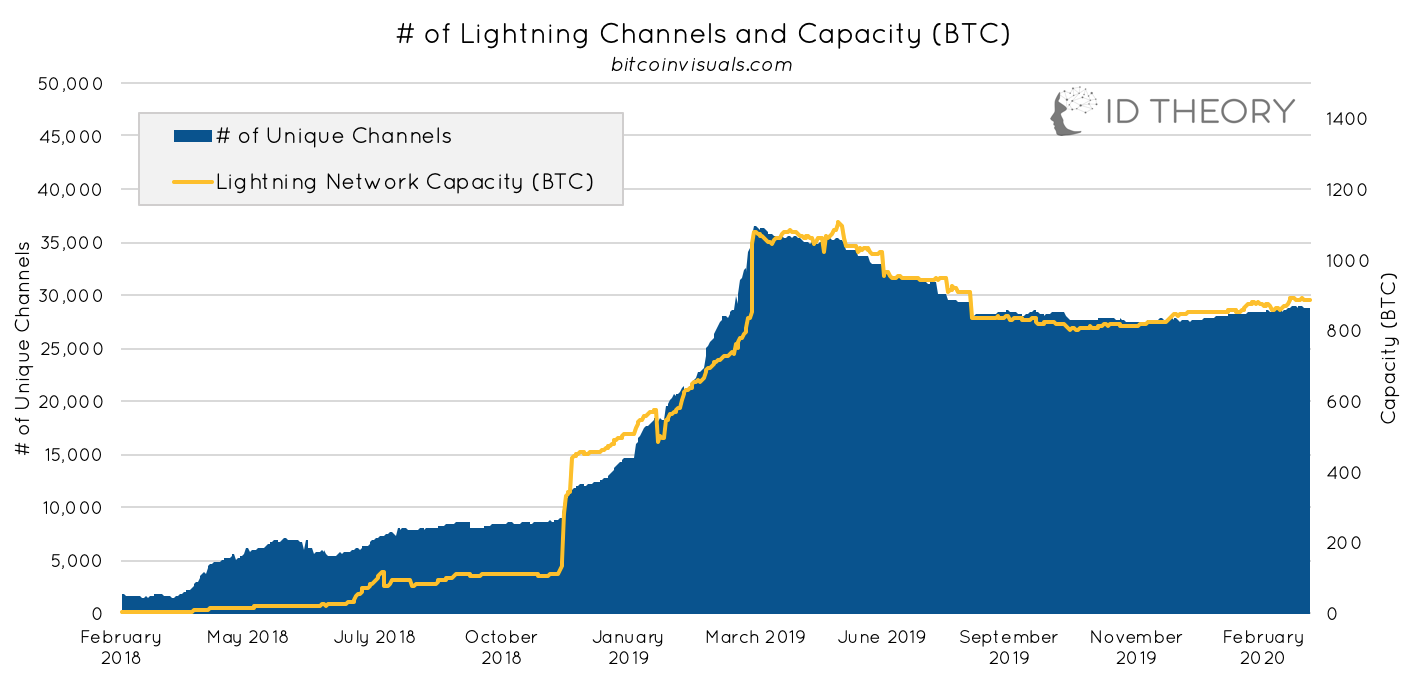
The number of unique channels on the lightning network is flat for the week. The BTC capacity on the Lightning Network is also flat for the week (total capacity is ~888 BTC).
Wrapped BTC
![](https://substackcdn.com/image/fetch/w_1456,c_limit,f_auto,q_auto:good,fl_progressive:steep/https%3A%2F%2Fbucketeer-e05bbc84-baa3-437e-9518-adb32be77984.s3.amazonaws.com%2Fpublic%2Fimages%2F7e2c4a8b-f3a4-4193-866e-eac97899ae67_1532x736.png)
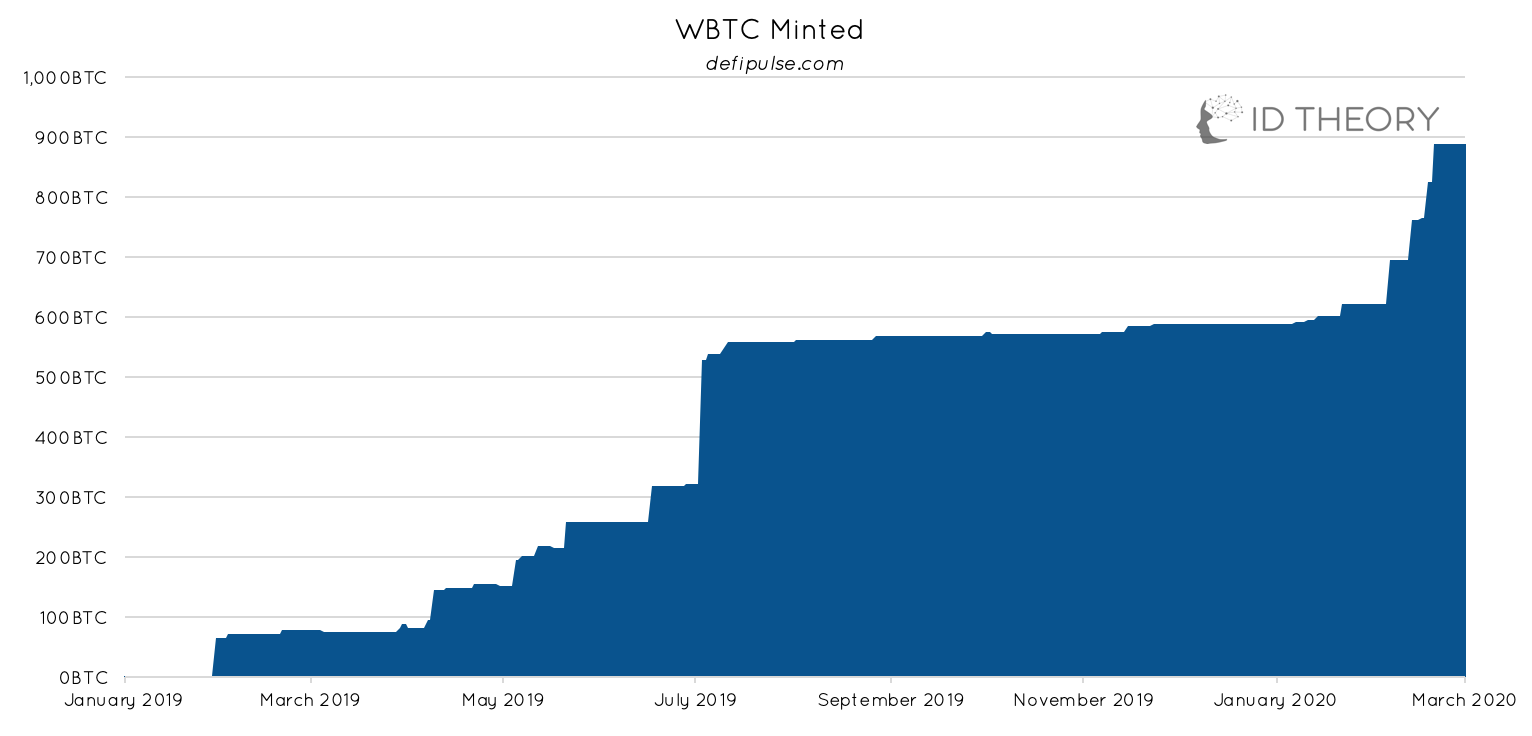
The total value of Wrapped BTC is flat for the past week. There are now 888 WBTC.
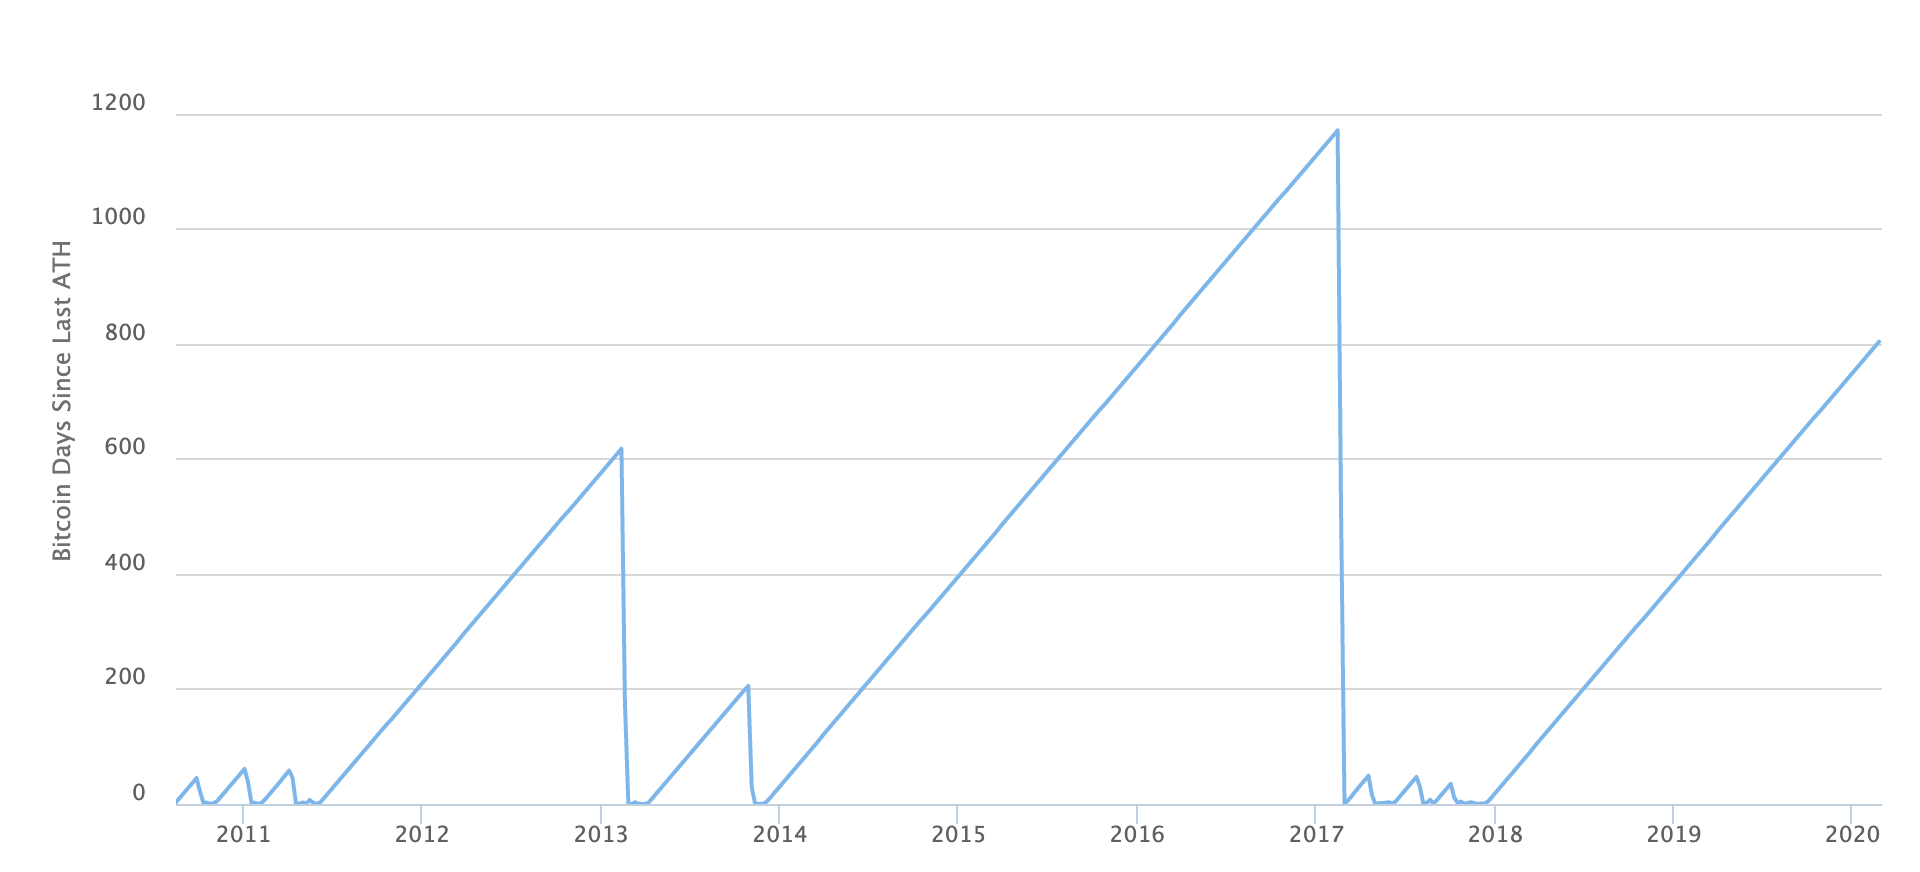
BTC Days Since All Time High
![](https://substackcdn.com/image/fetch/w_1456,c_limit,f_auto,q_auto:good,fl_progressive:steep/https%3A%2F%2Fbucketeer-e05bbc84-baa3-437e-9518-adb32be77984.s3.amazonaws.com%2Fpublic%2Fimages%2Ff7dde080-31df-4dc6-a7c8-6c33957b5d77_1920x872.png)
Spotlight
![Twitter avatar for @100trillionUSD](https://substackcdn.com/image/twitter_name/w_96/100trillionUSD.jpg)
![Image](https://substackcdn.com/image/fetch/w_600,c_limit,f_auto,q_auto:good,fl_progressive:steep/https%3A%2F%2Fpbs.substack.com%2Fmedia%2FESBqPZPXUAAud6m.png)
This week’s spotlight comes PlanB who modelled the value of Bitcoin according to a stock-to-flow model. PlanB highlights that the Bitcoin halving is now only ~2 months away when the BTC block rewards given to miners securing the network will be halved from 12.5 BTC to 6.25 BTC meaning there will be a supply shock. To learn more about the stock-to-flow model and why he believes the circulating supply of BTC is related to its price, see PlanB’s original article here.
Tweet of the Week
![Twitter avatar for @nlw](https://substackcdn.com/image/twitter_name/w_96/nlw.jpg)
![](https://substackcdn.com/image/fetch/w_600,h_314,c_fill,f_auto,q_auto:good,fl_progressive:steep/https%3A%2F%2Fbucketeer-e05bbc84-baa3-437e-9518-adb32be77984.s3.amazonaws.com%2Fpublic%2Fimages%2F316ca1fe-626e-4c55-a69e-255c6703318e_853x600.jpeg)
Our ‘tweet of the week’ comes from writer Nathaniel Whittemore who published his ‘Long Read Sunday’ - a collection of writing and tweets that covers key themes developing in the last week. With the coronavirus spreading and equities markets showing sharp declines last week, one of the main points of discussion was the assessment of Bitcoin as a safe haven asset in light of these recent events and how this narrative will likely develop in the coming months. You can read and subscribe to Nathaniel’s ‘Long Reads Sunday’ newsletter here.
![](https://substackcdn.com/image/fetch/w_1456,c_limit,f_auto,q_auto:good,fl_progressive:steep/https%3A%2F%2Fbucketeer-e05bbc84-baa3-437e-9518-adb32be77984.s3.amazonaws.com%2Fpublic%2Fimages%2Ffb53e31a-ab36-44cb-a190-5c75f61ede20_202x202.png)
About the Author
Lewis Harland is an analyst at ID Theory and is a full-time researcher of decentralised networks and cryptoassets.
ID Theory Ltd. is an Investment Advisor for cryptoasset investment fund, IDT Crypto Asset Fund Ltd.
Interested in partnering with ID Theory or building something special? Get in touch through our website or at info@idtheory.io.