

ID Theory Insights
ID Theory is a London-based cryptoasset investment firm. Our weekly Insights report provides the latest key macro as well as on-chain data for Bitcoin. If you would like to receive insights directly to your inbox, you can subscribe here:
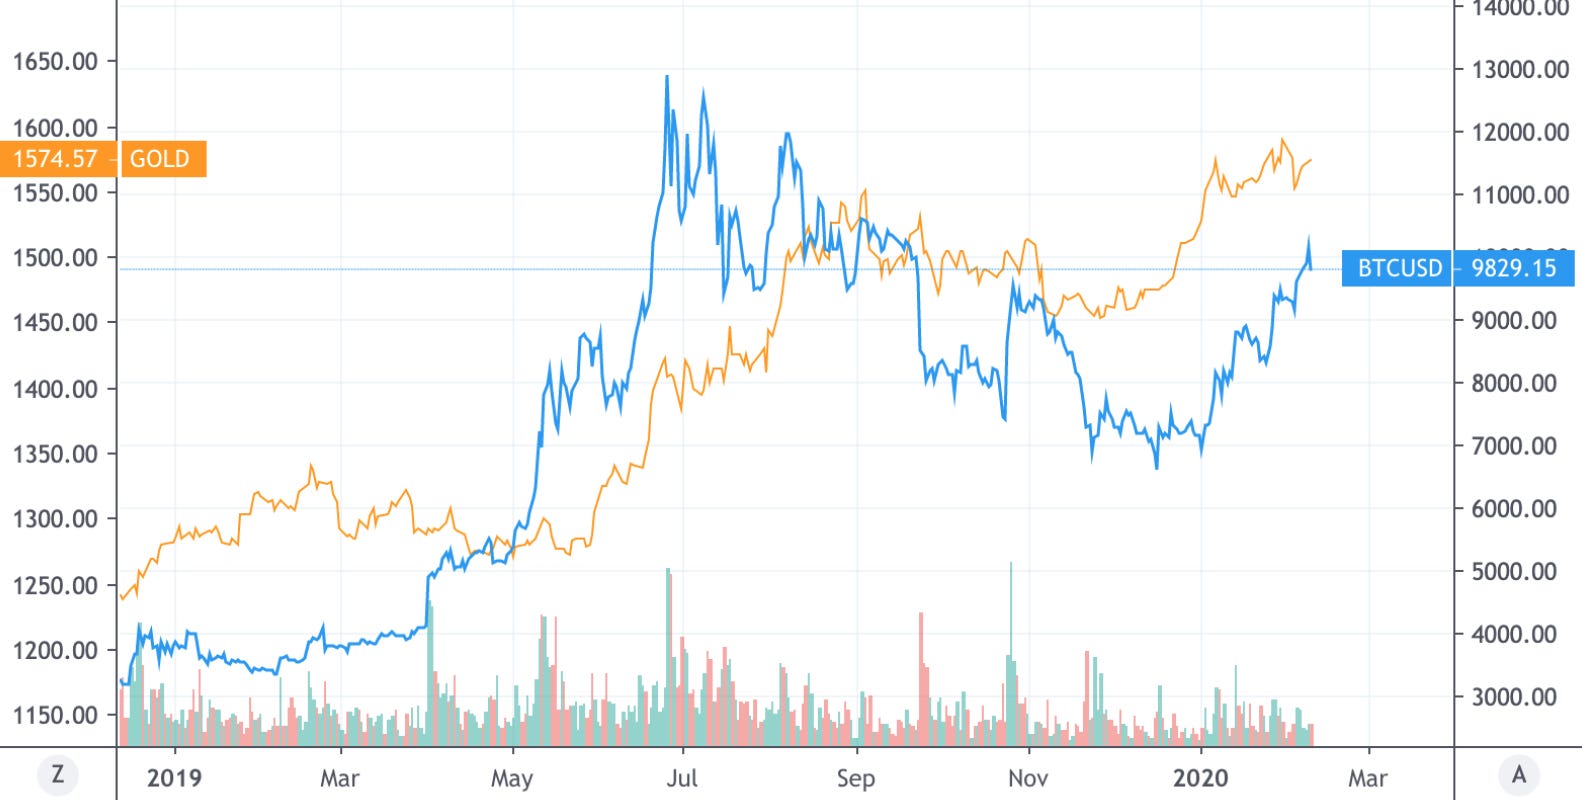
BTC and Gold
Gold has served as a safe haven asset for 1000’s of years. Any positive correlation may indicate BTC beginning to earn safe haven status.
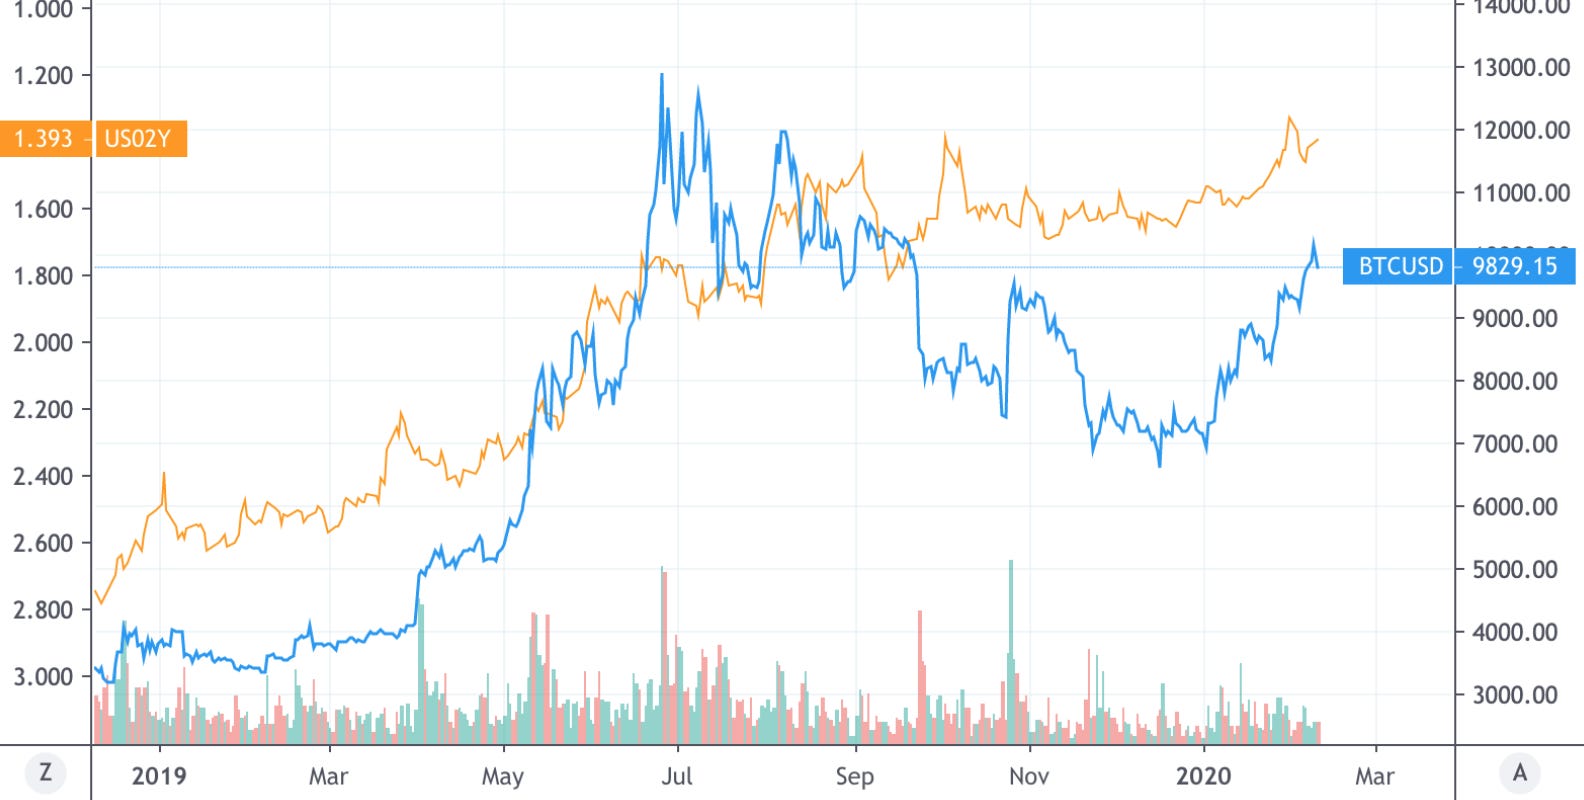
BTC and Inverted US 2 Year Treasury Yield
In a risk-off environment Treasury yields drop. Positive correlation here points to BTC being considered a risk-off asset.
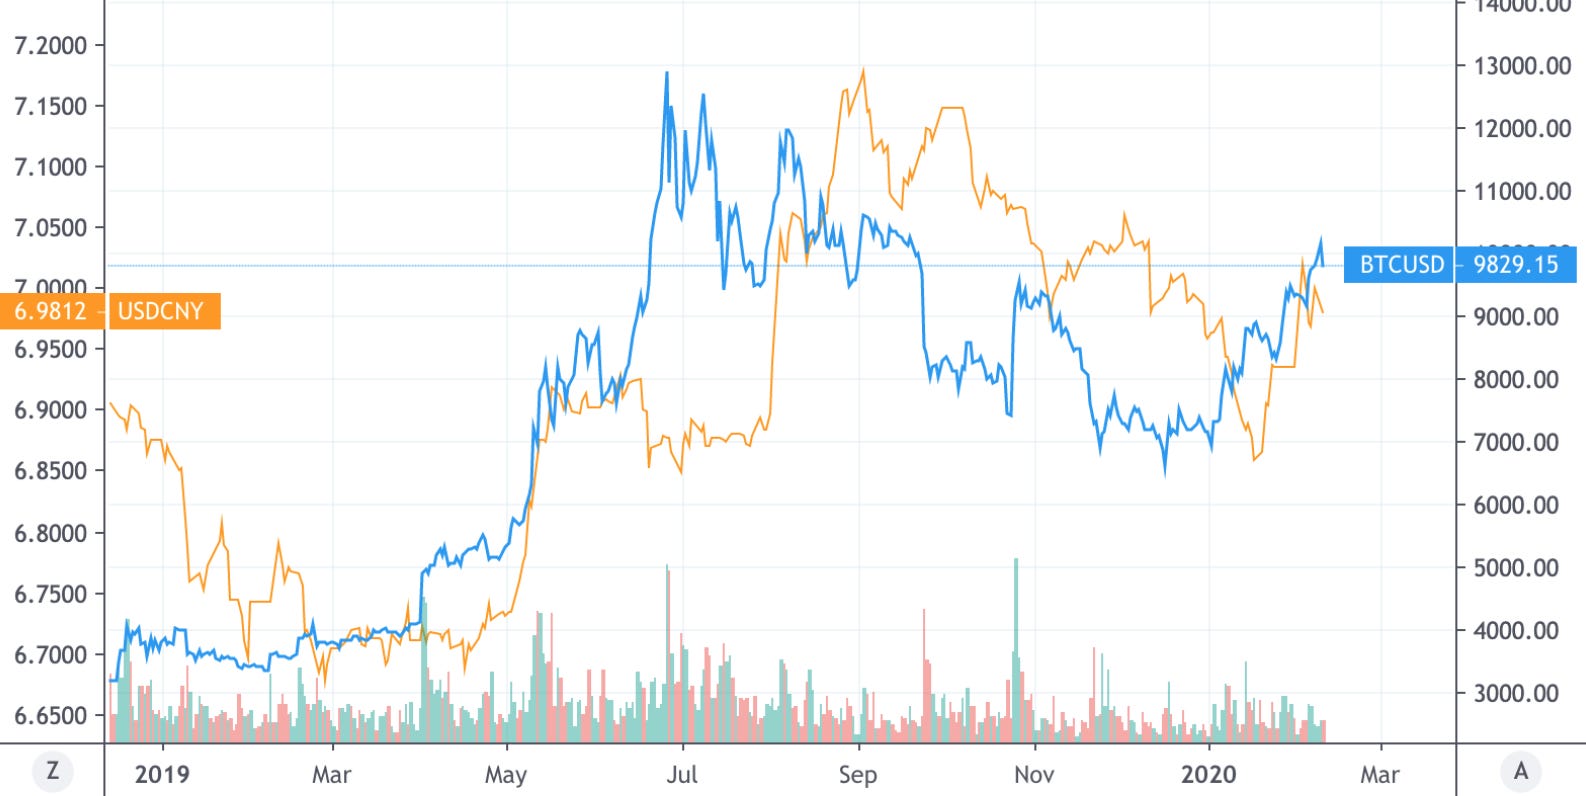
BTC and USD/CNY
Weakening CNY may lead to a greater demand for capital flight from China. Positive correlation here may indicate BTC is being used as a mechanism for this flow.
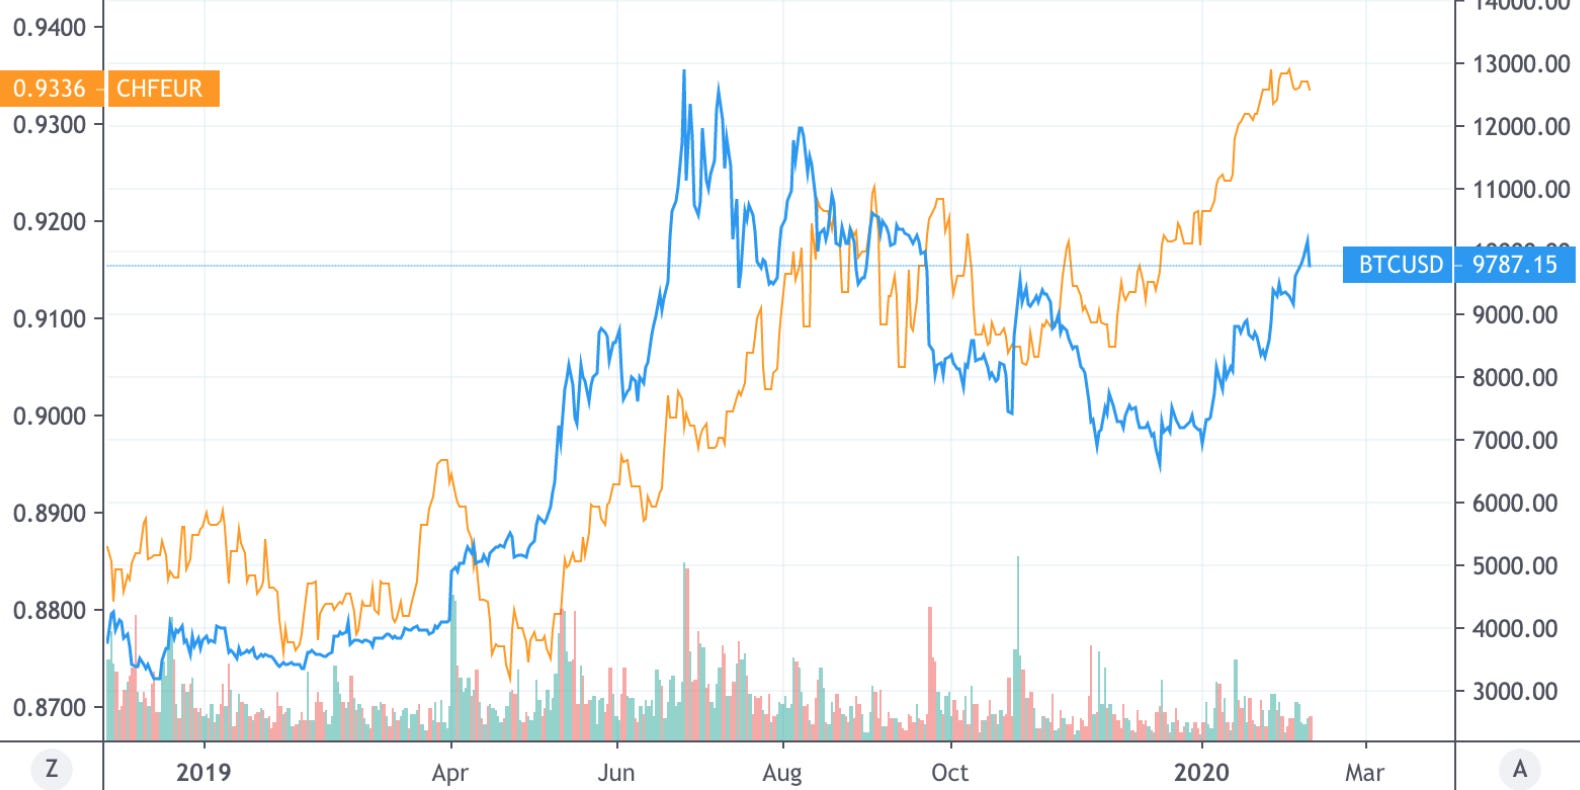
BTC and CHF/EUR
The Swiss Franc (CHF) is a safe haven currency. If there is correlation between CHF strengthening against EUR, this may indicate BTC being utilised as a risk-off asset.
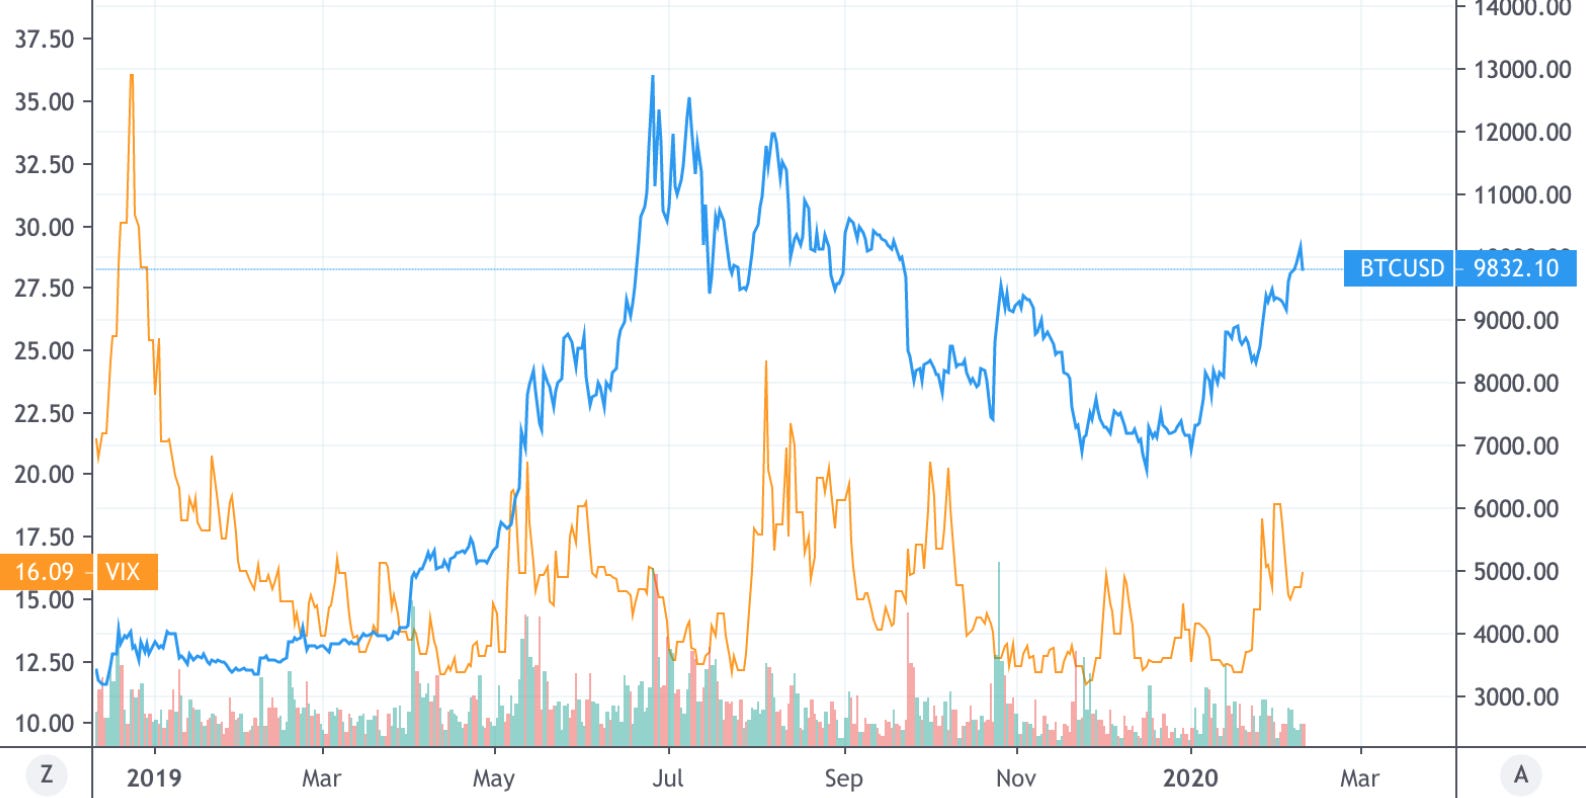
BTC and VIX
Volatility (represented by the VIX) generally increases in times of economic uncertainty. Strong correlation between the VIX and BTC may indicate it be utilised as a risk-off asset.
BTC and SMAs
Simple moving averages (SMA’s) smooth price histories by averaging daily prices over a given period of time. Crossing moving averages represent a shift in momentum.
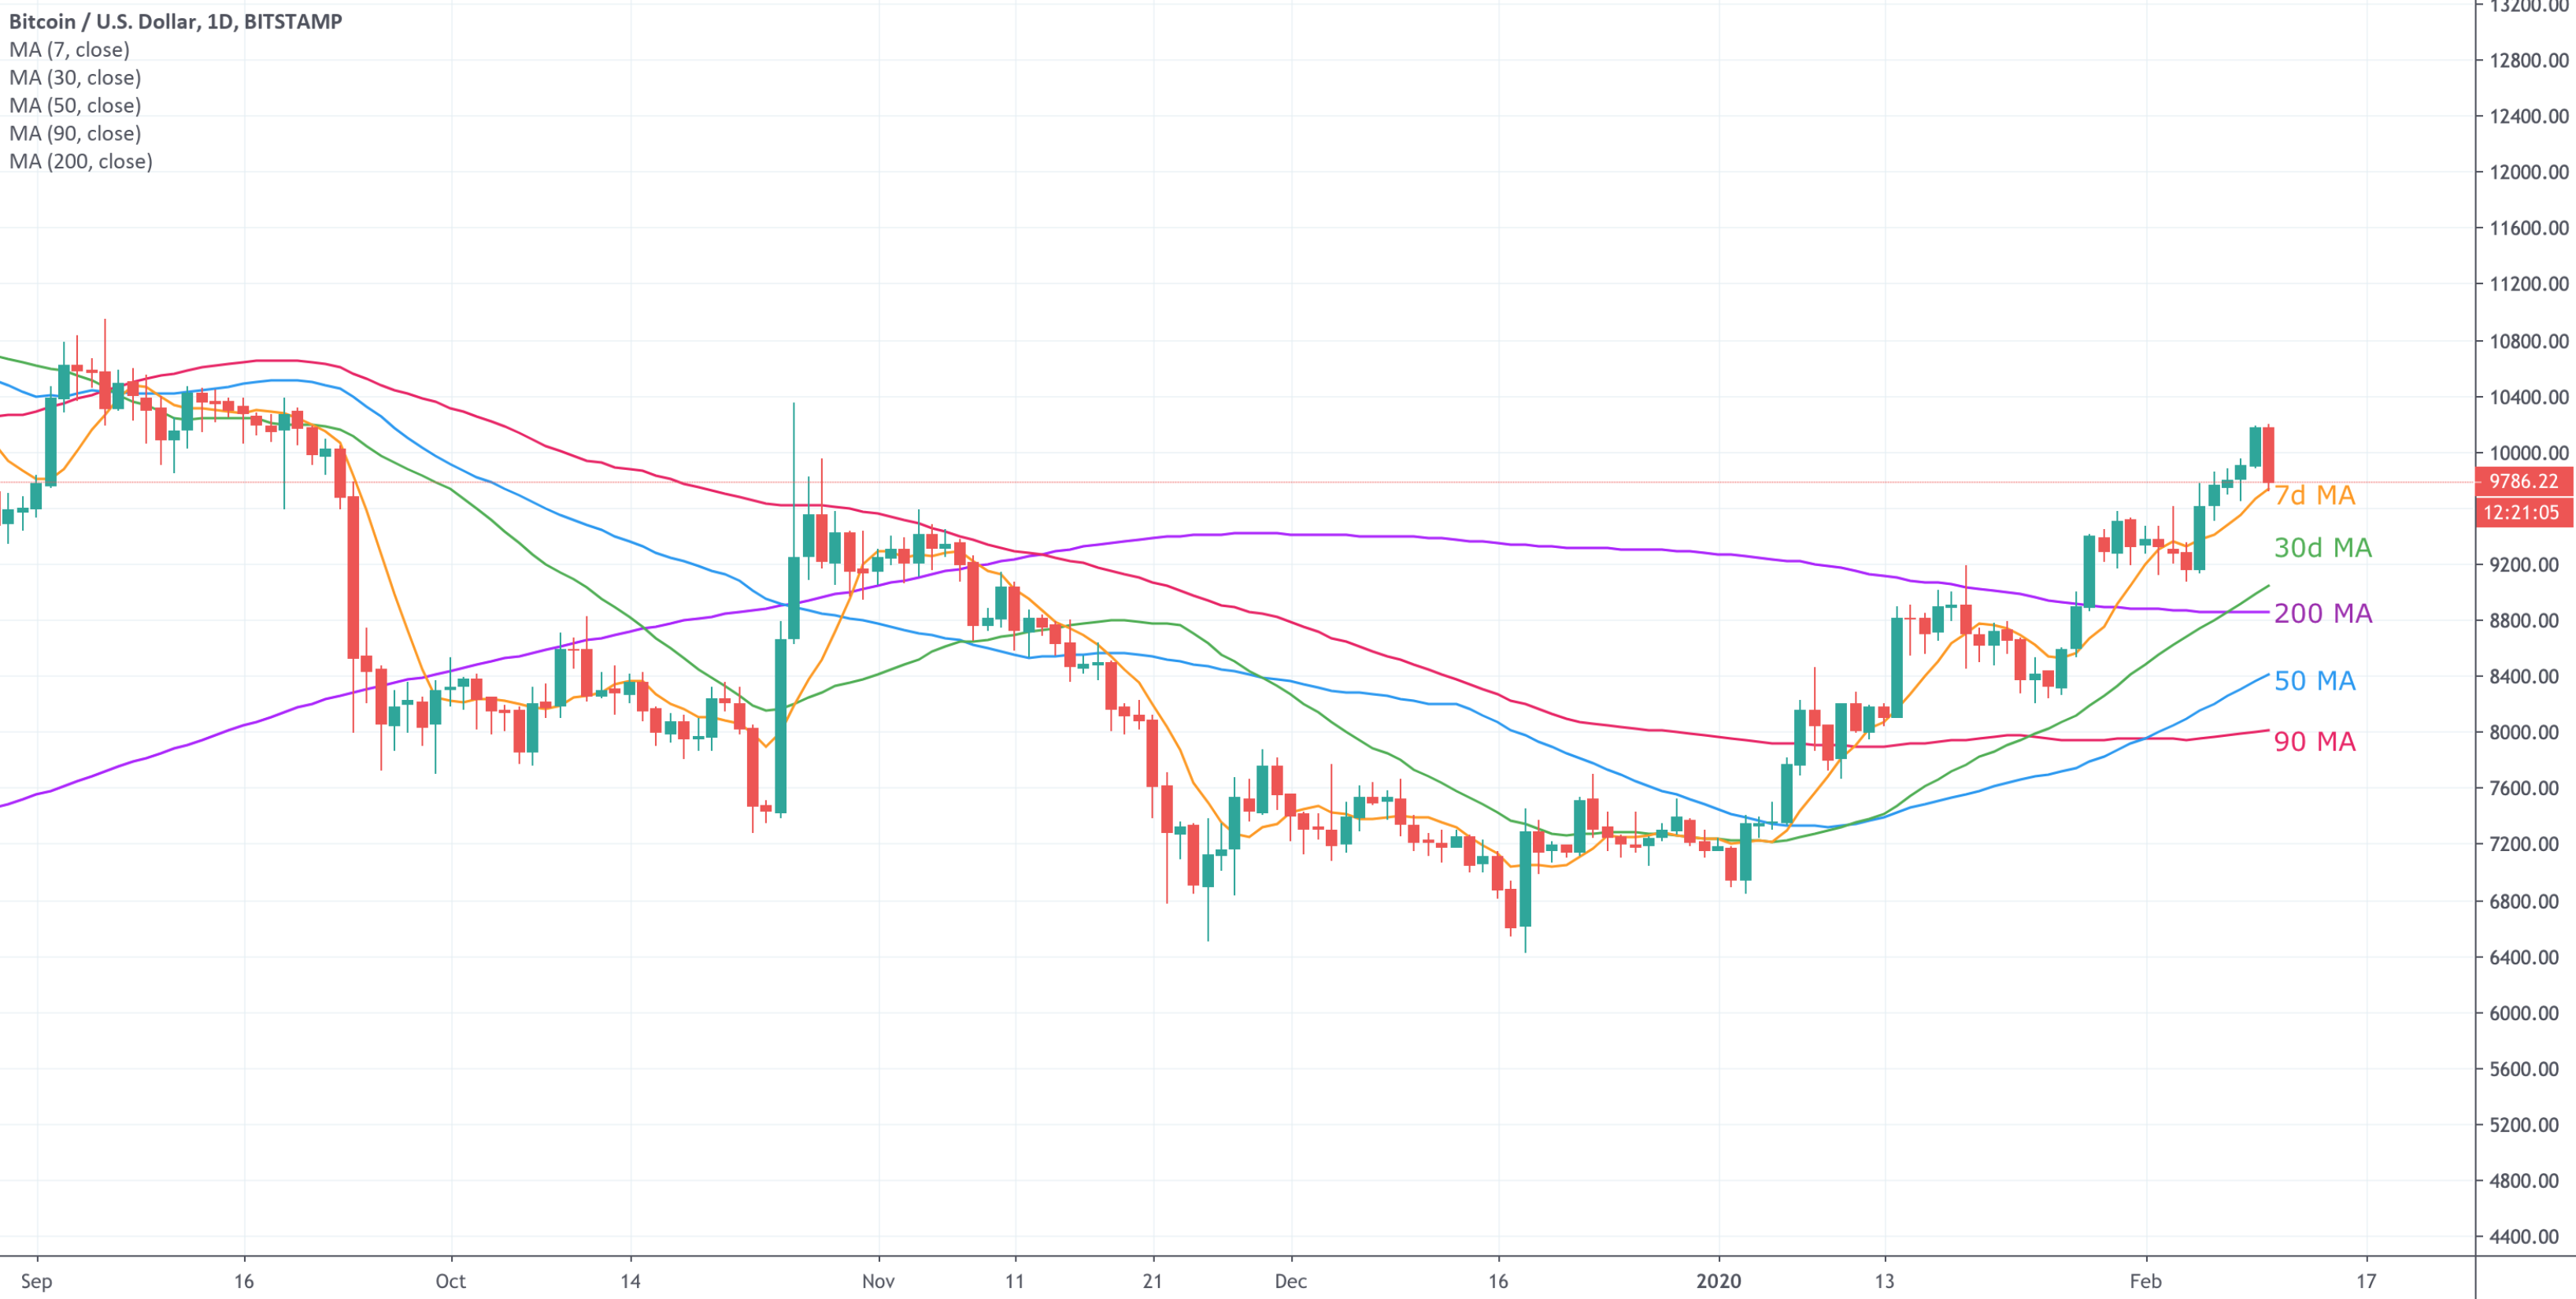
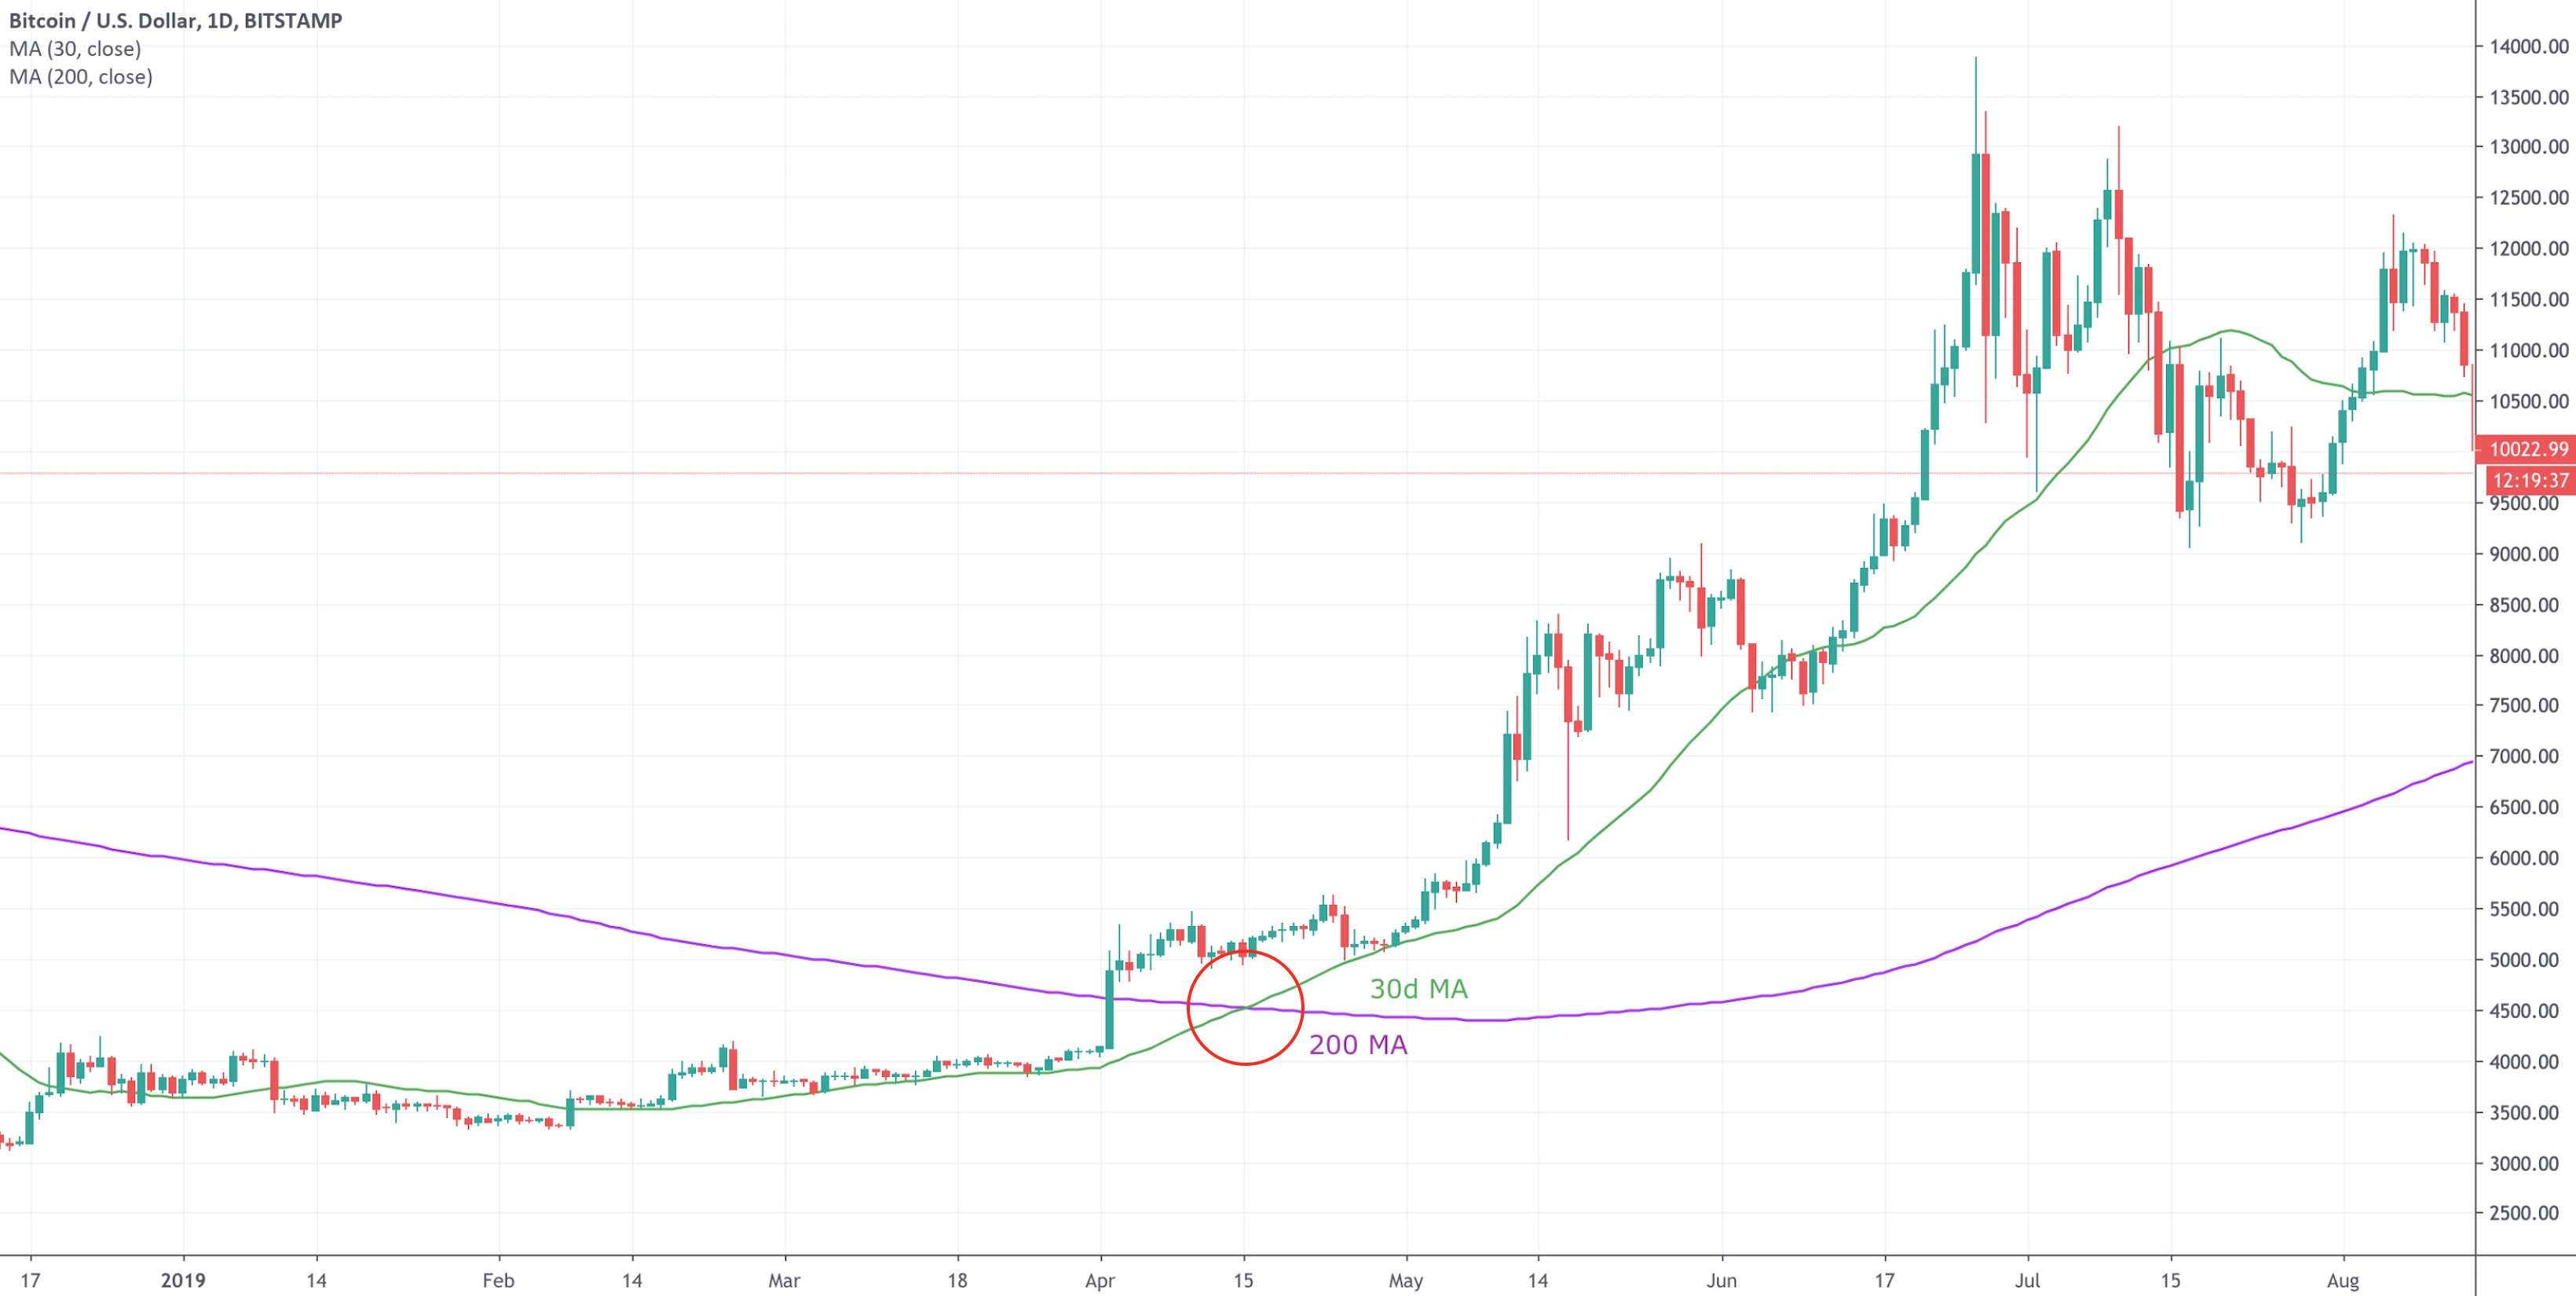
Last week saw BTC 30d MA cross over the 200d MA on the 7th February. The last time this occurred was on the 16th of April foreshadowing its rise to the ATH of 2019.
April 2019
BTC and MACD
MACD (moving average convergence/divergence) is a momentum indicator showing the relationship between two moving averages of a price. It is designed to reveal changes in the strength, direction, momentum and duration of a trend.
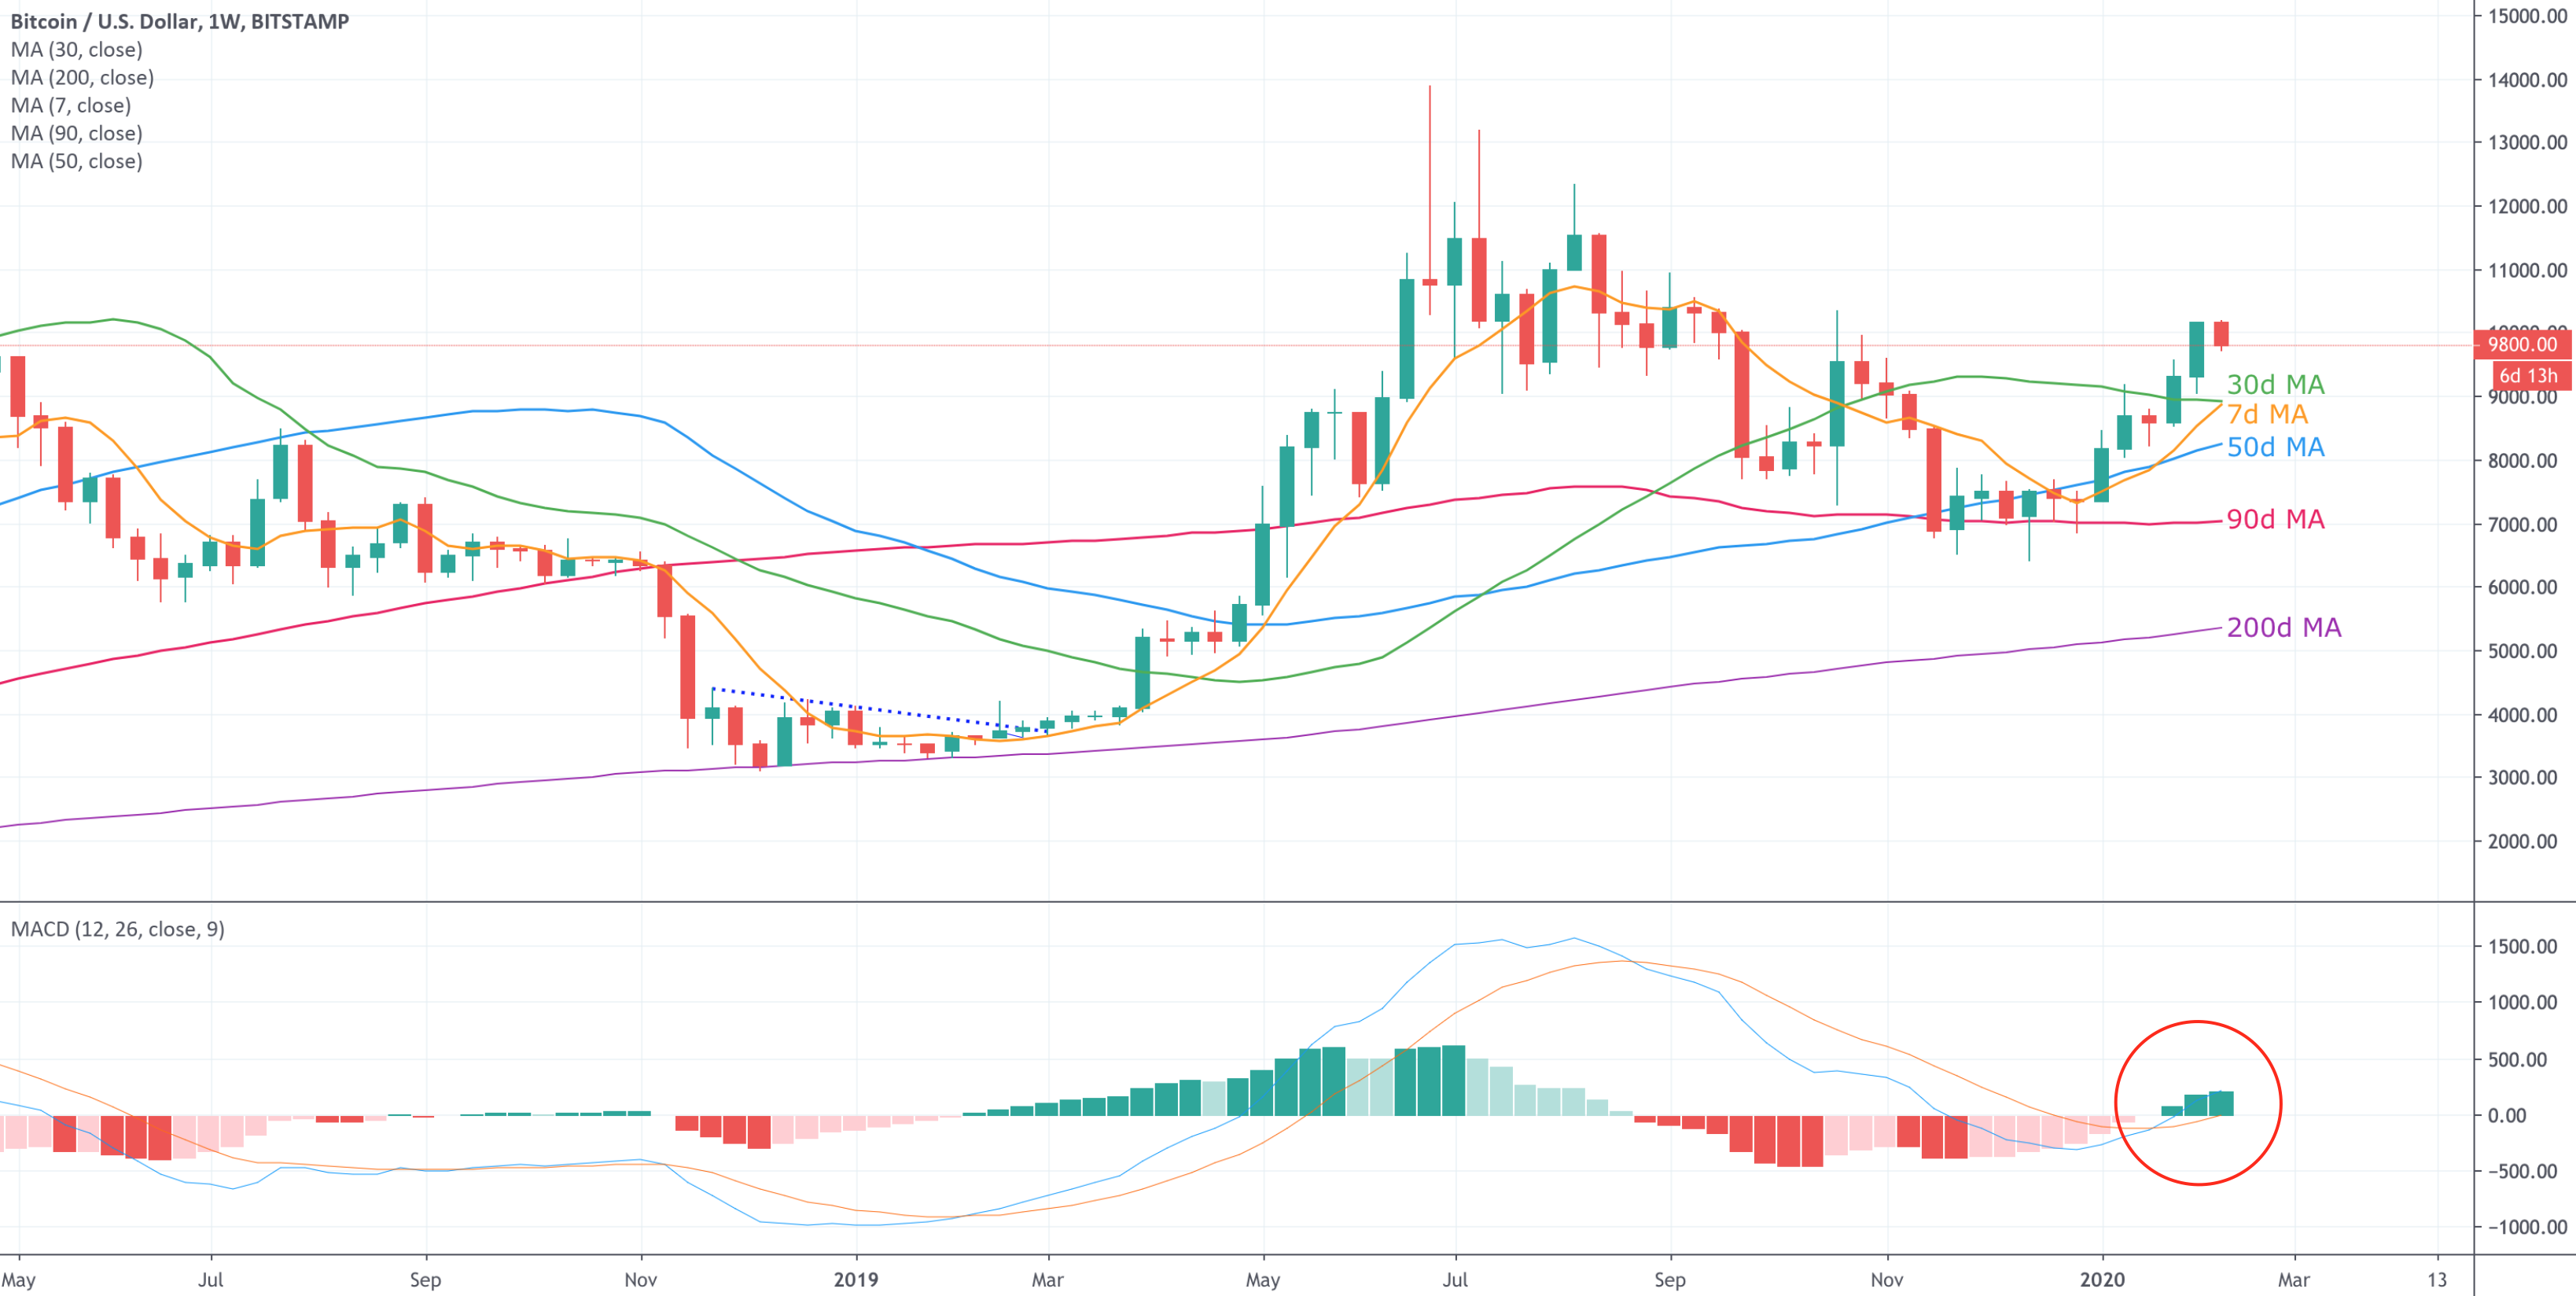
The weekly MACD continues to indicate a bullish continuation after the crossover on the 20th January.
Bitcoin Price Action

2020 is still the best performing year for BTC since 2013 with price up 42% YTD.
Bitcoin Derivative Market
The Commitment of Traders (COT) is a weekly report issued by the CFTC enumerating the holdings of participants in the Futures market. Dealer/Intermediary represents the sell side, Asset Manager/Institutional represents the buy-side.


Institutional sentiment has shifted as Asset Managers have reduced their long positions.
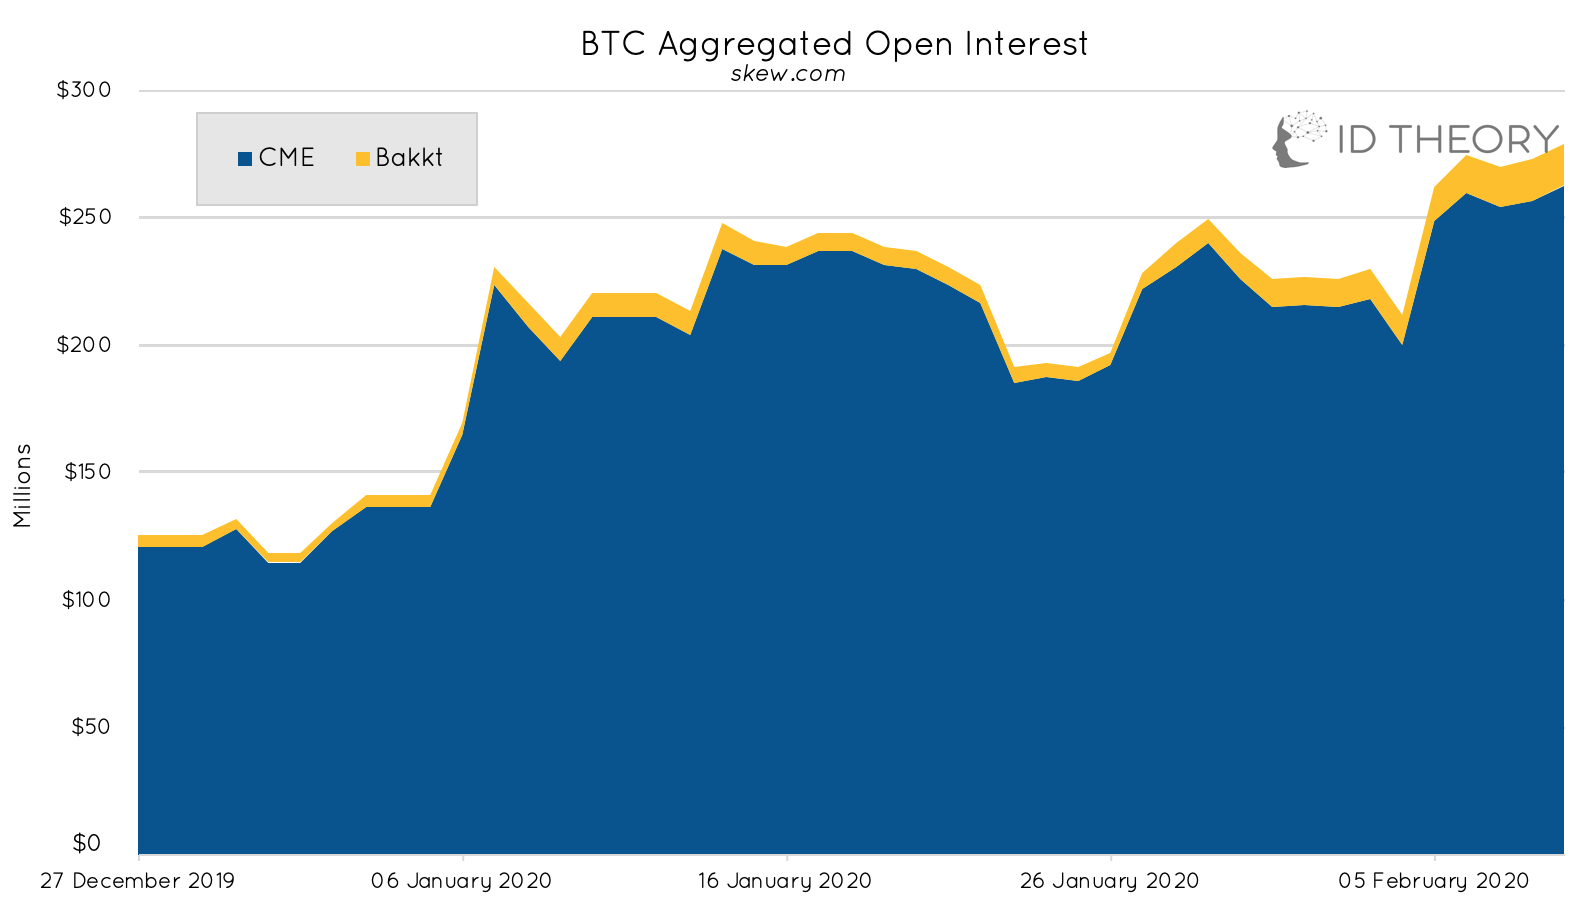
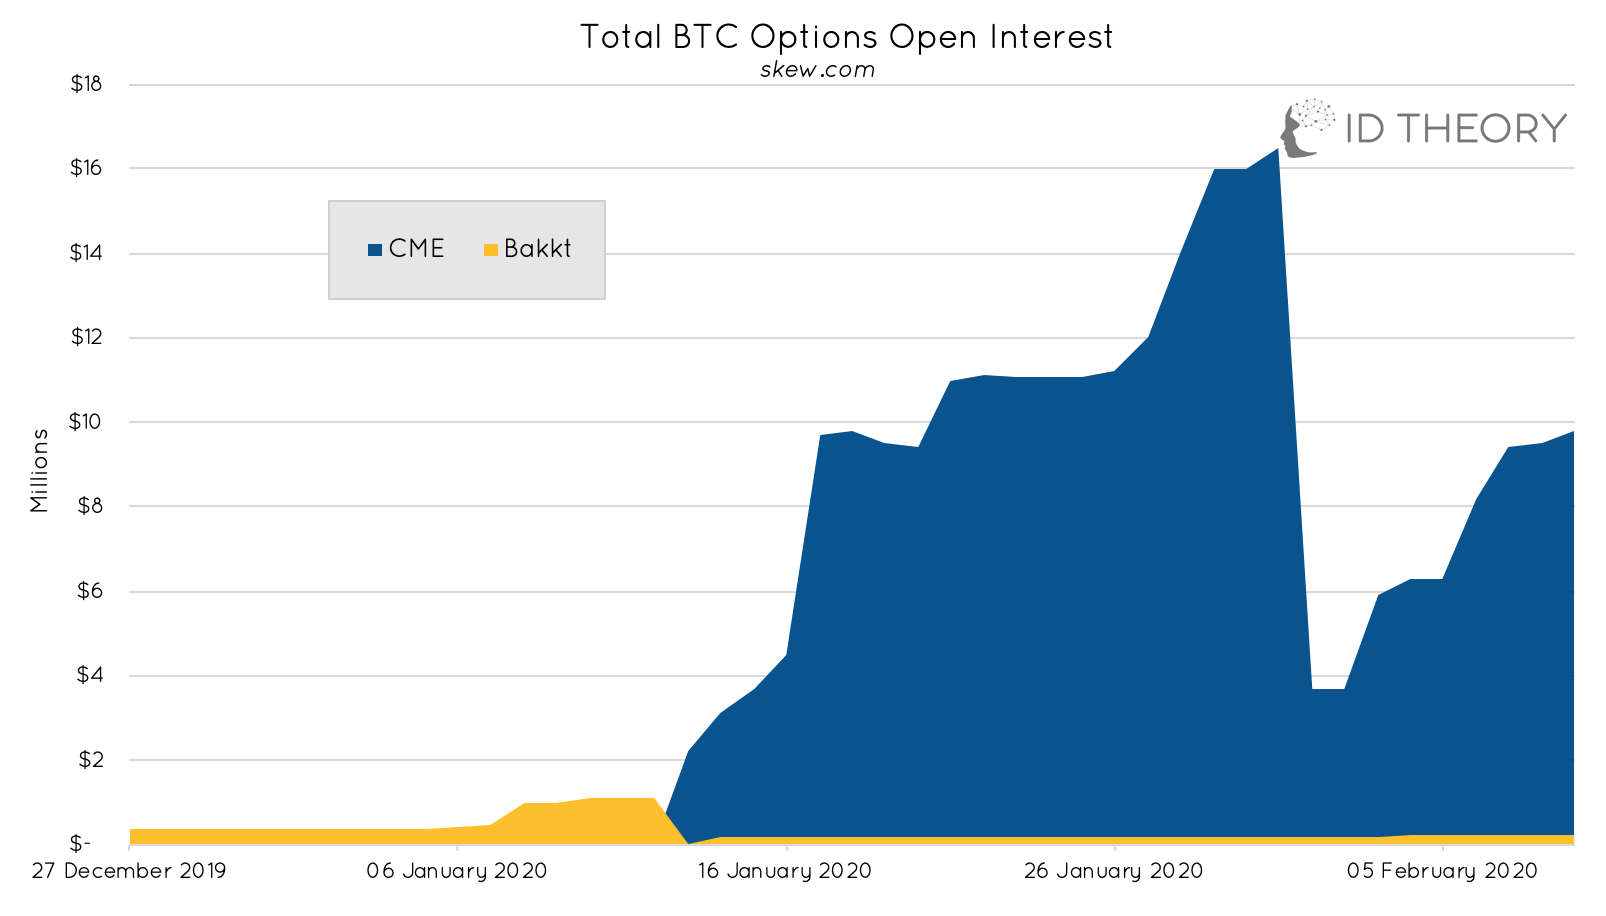
Open interest shows the USD value of open contracts offered by various platforms.
Fundamentals
Google Trends - ‘Bitcoin Halving’
The Bitcoin halving is an event where the number of bitcoins rewarded to miners per block will be halved. This is a feature programmed into the Bitcoin protocol that occurs every 4 years and is essentially a reduction in the supply of bitcoin by half. The next halving will occur in May 2020.
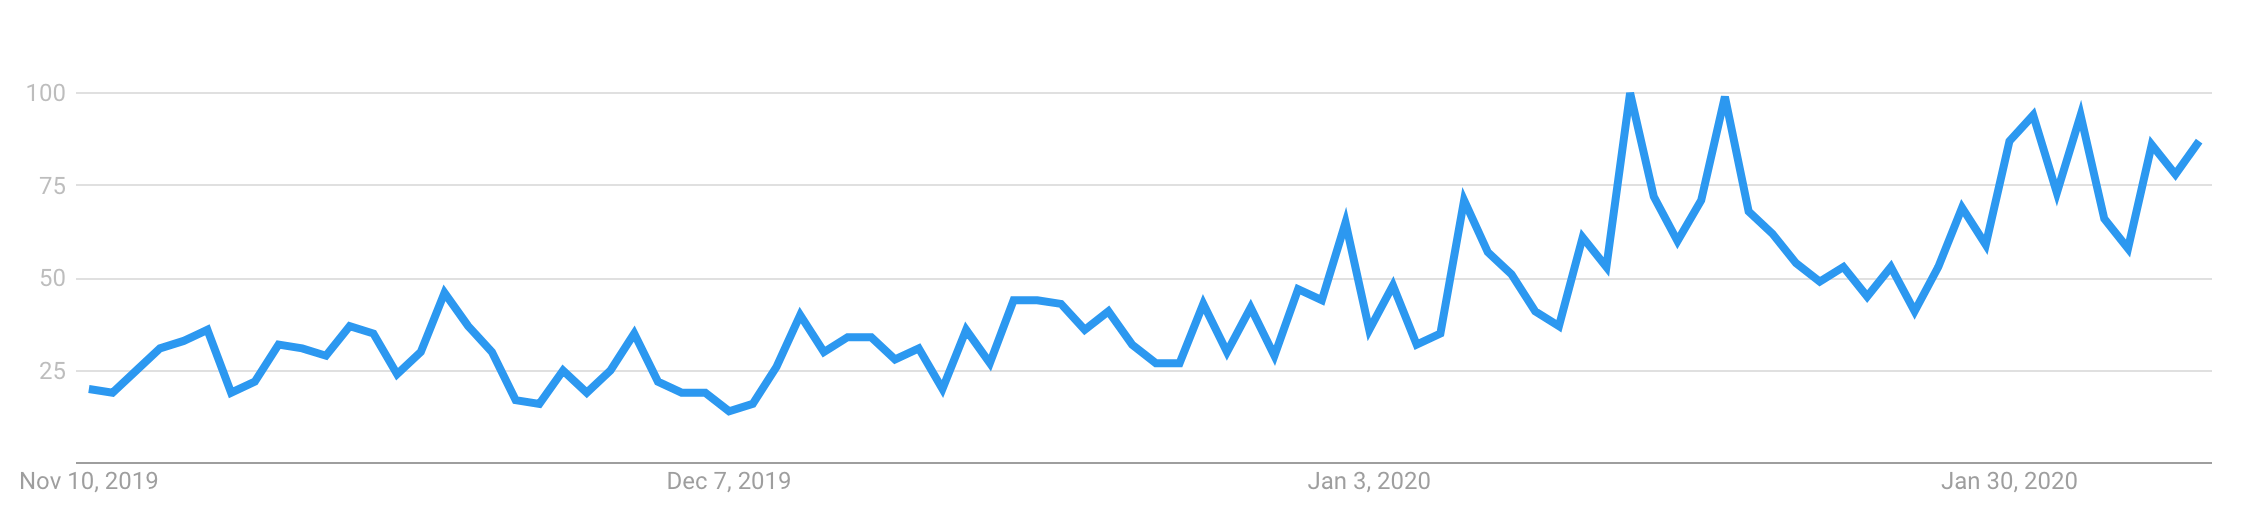
Worldwide searches for ‘Bitcoin Halving’ last week continue to trend upwards.
WeChat Index - ‘Bitcoin’
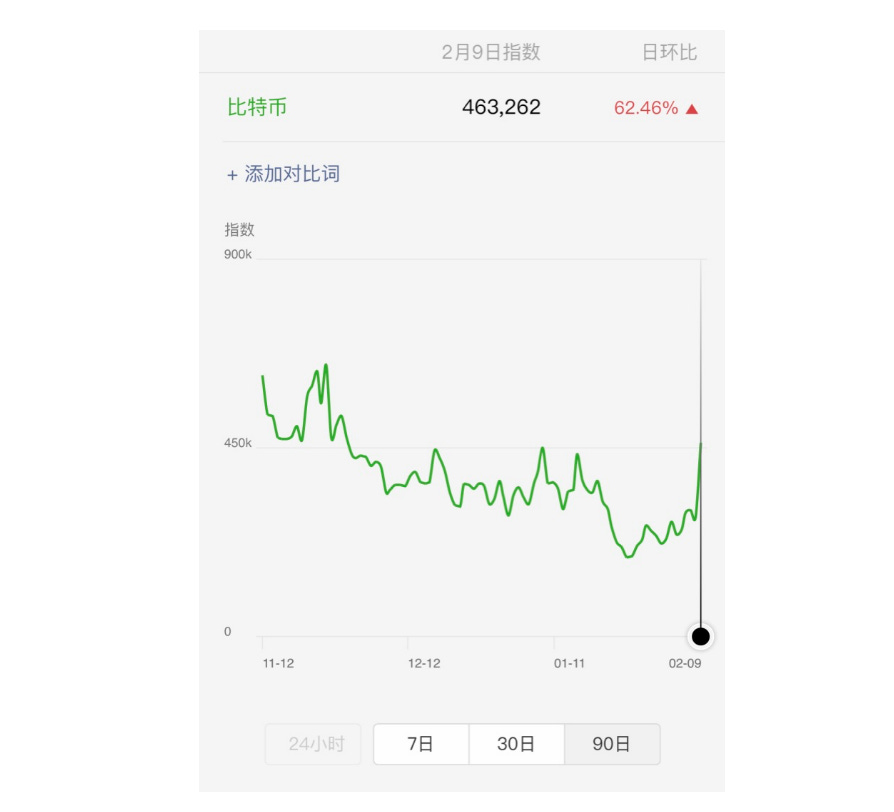
WeChat Index shows that searches for ‘Bitcoin’ were up 62% on the 9th February. Searches are 144% up since December 25th which was the local low for the 90 day period.
Localbitcoins Volume - Global
LocalBitcoins and Paxful are both platforms that facilitate over the counter and peer-2-peer trading for bitcoin from local currencies.
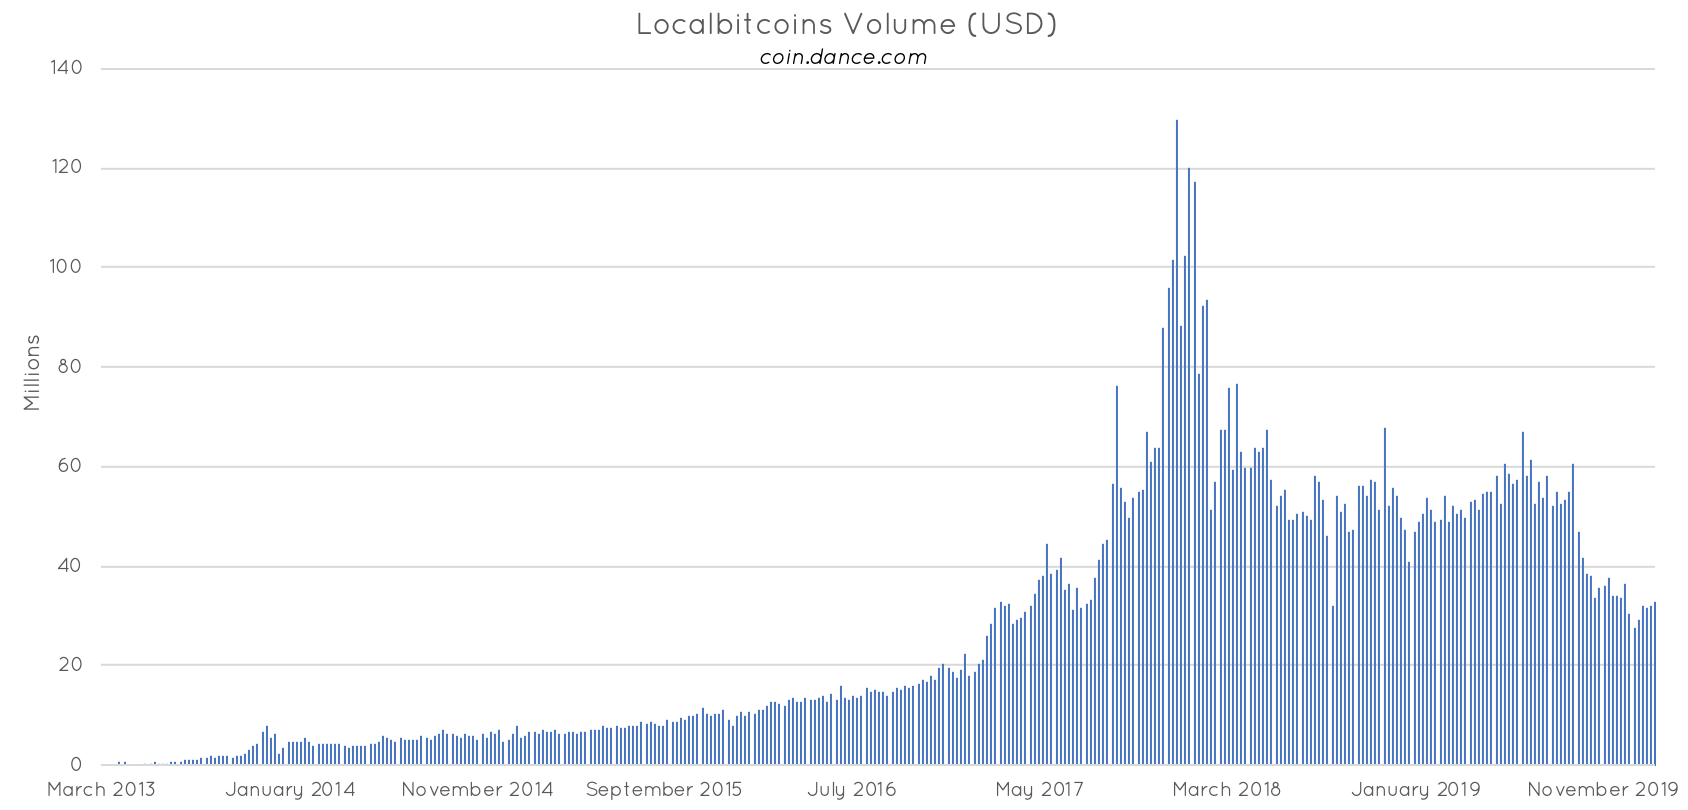
BTC traded volume on Localbitcoins has risen slightly from $32m in the previous week to $32.6m.

Paxful on the other hand has seen the reverse - a slight decrease this week from $24m to $23m.

Relative market share continues to shift in favour of Paxful for p-2-p trading of bitcoin.
Confirmed Transactions Per Day
Represents the number of transactions completed on the Bitcoin network within a 24 hour period. The higher the number the more the network is being utilised.
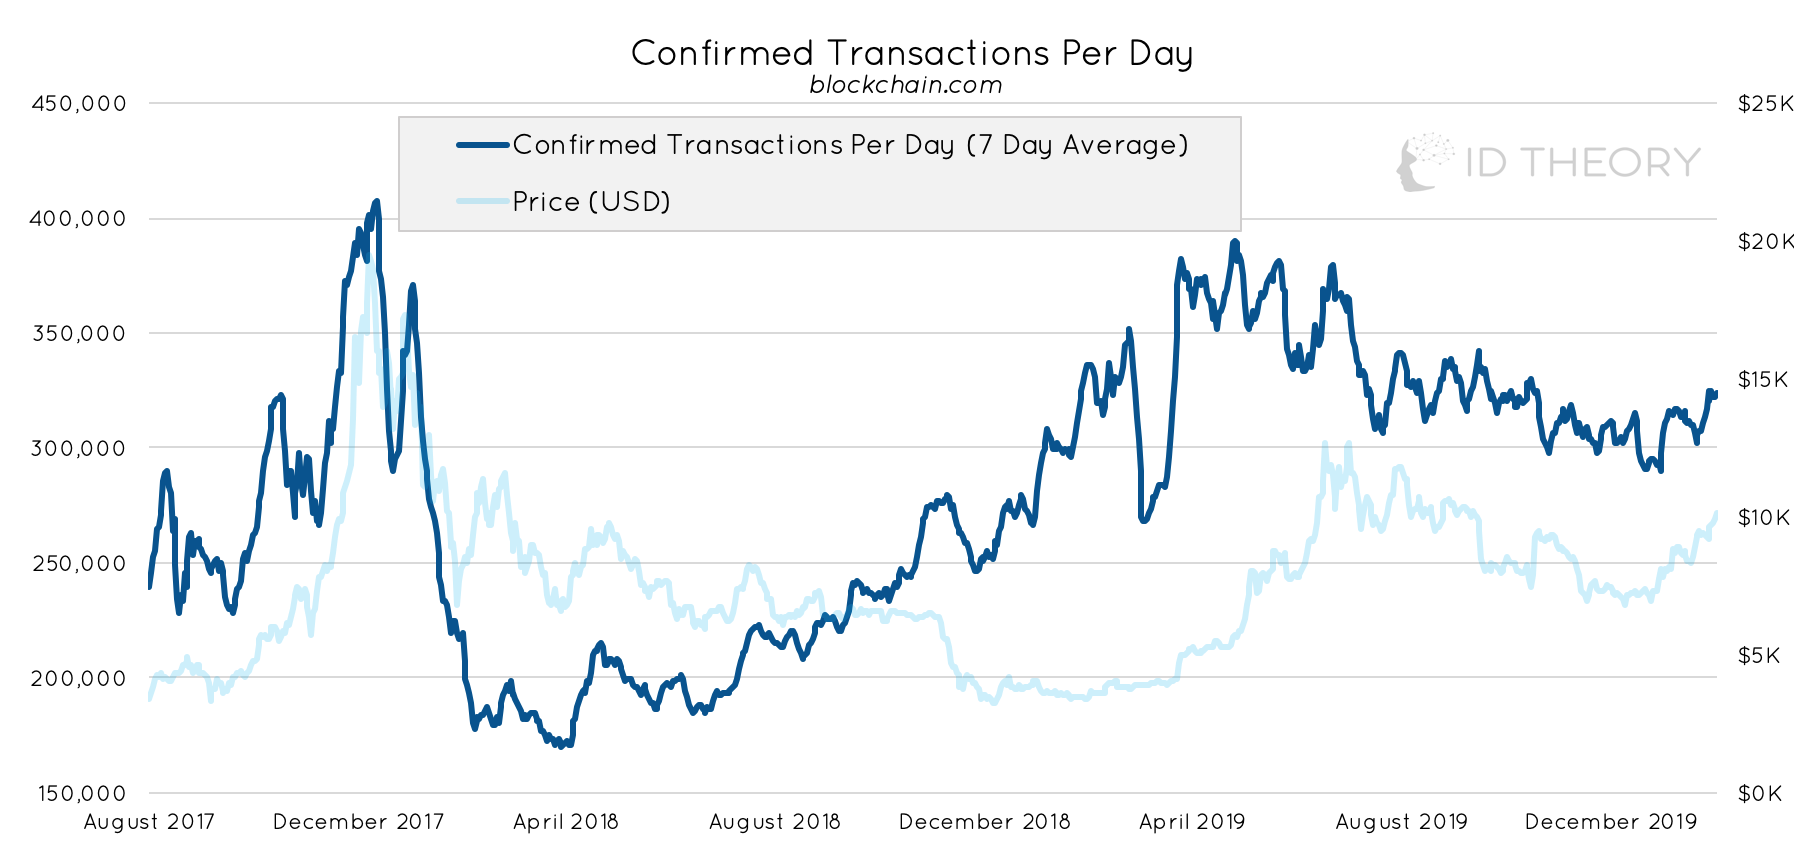
Confirmed transactions are up 3.5% since last week and up 10% YTD.
Mean Transaction Value
This is the average size of each transaction being processed by the Bitcoin network.
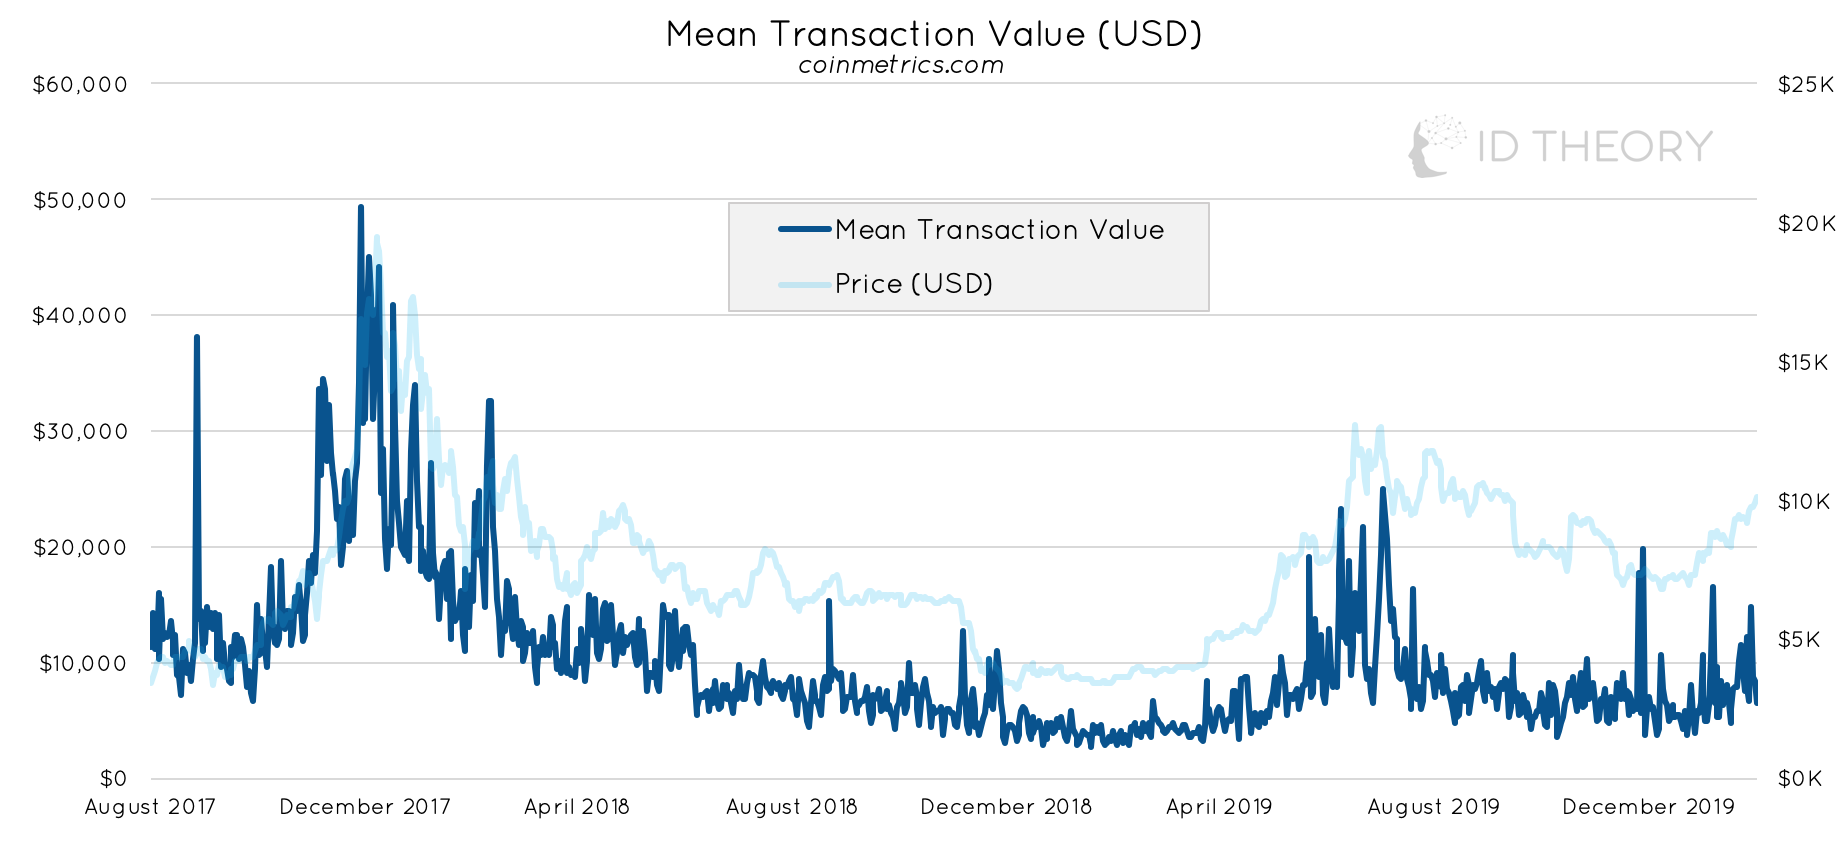
The mean transaction value has decreased 15% for the week but is still up 75% YTD.
Bitcoin Economic Throughput
Economic throughput is the transactions per day multiplied by the mean transaction value. It is a measure of the financial bandwidth of the Bitcoin network per unit of time and represents the value flowing through the system.

Current economic throughput is up 10% hovering around $3Bn USD (up 93% YTD on the 7d MA).
Hashrate
The Hashrate is a measure of the processing power contributed by miners to secure the network. A higher hashrate means more equipment and electricity (i.e. CapEx) being dedicated to mining bitcoin.

Bitcoin hashrate (7 day moving average) is down 2% for the week. Hashrate is up 13% YTD. Currently at 109m TH/s on the 7 day moving average.
Daily Active Addresses
The number of addresses sending or receiving bitcoin. It is a proxy for the number of people using the Bitcoin network.

The daily active addresses count for Bitcoin is down 1.4% from the last week. Active address count is still up 33% YTD.
Bitcoin Days Destroyed
Bitcoin Days Destroyed (BDD) is an alternative metric for transaction volume on the Bitcoin network. It is calculated by taking the number of Bitcoins in a transaction and multiplying it by the number of days it has been since those coins were last spent.
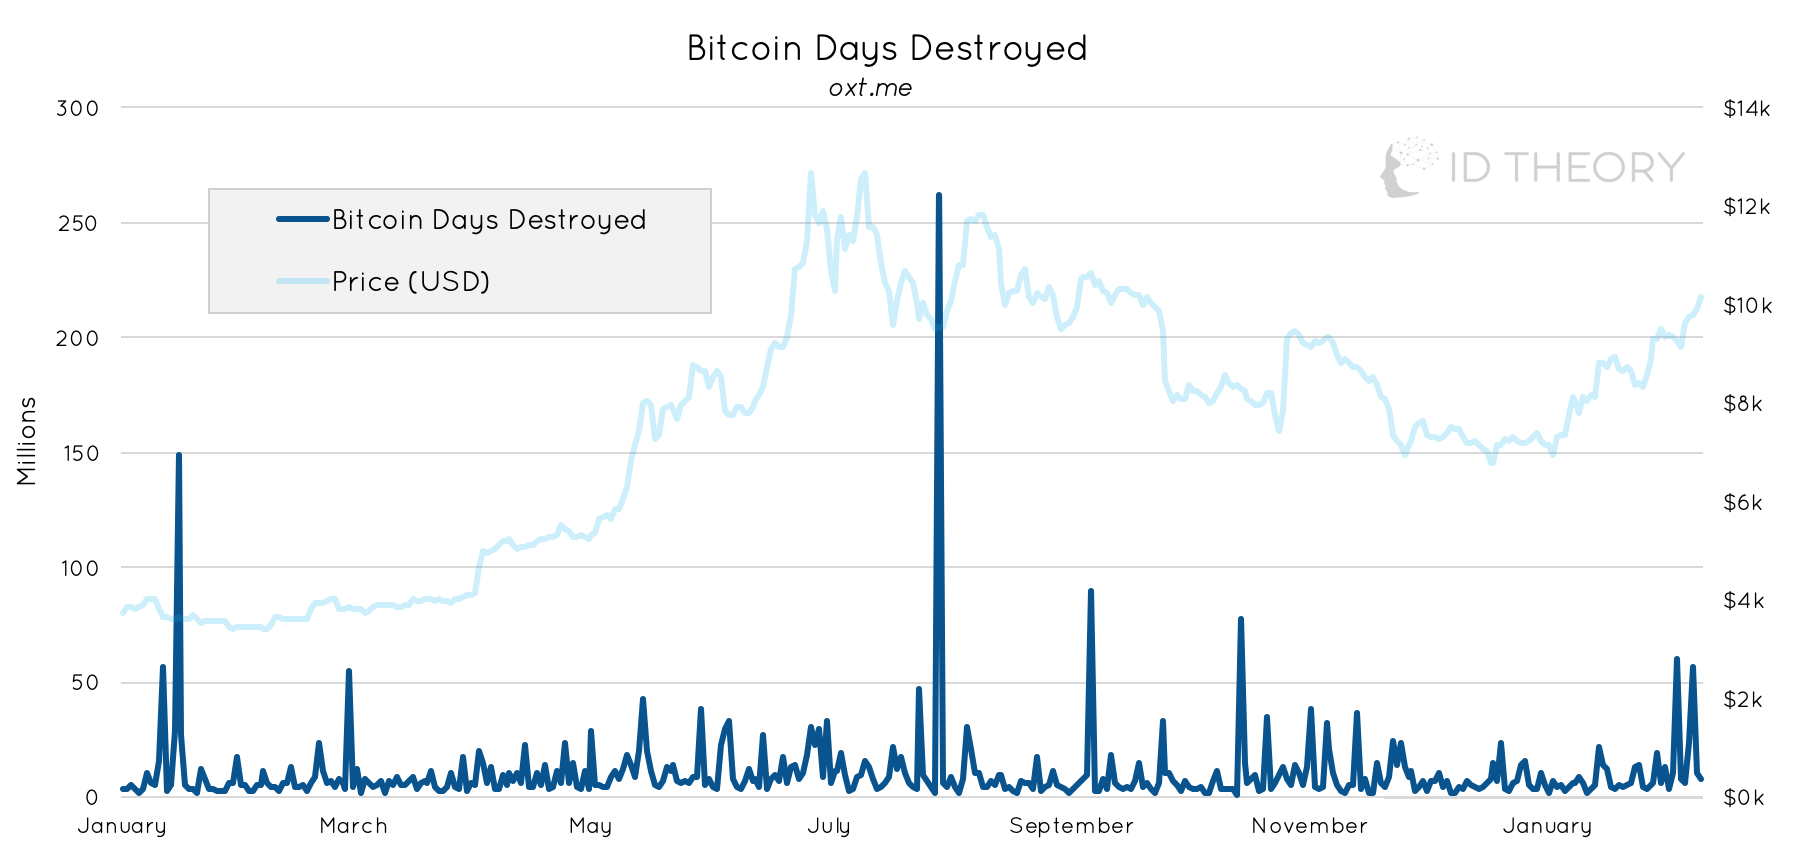
During the last week there were two spikes in activity on the 3rd and 7th February (60m and 56m respectively).
Realised Cap
This metric approximates the value paid for all coins in existence by summing the market value of coins at the time they last moved on the blockchain. It was developed by the Coinmetrics team in response to the flaws inherent with looking at traditional Market Capitalisation (MCap).
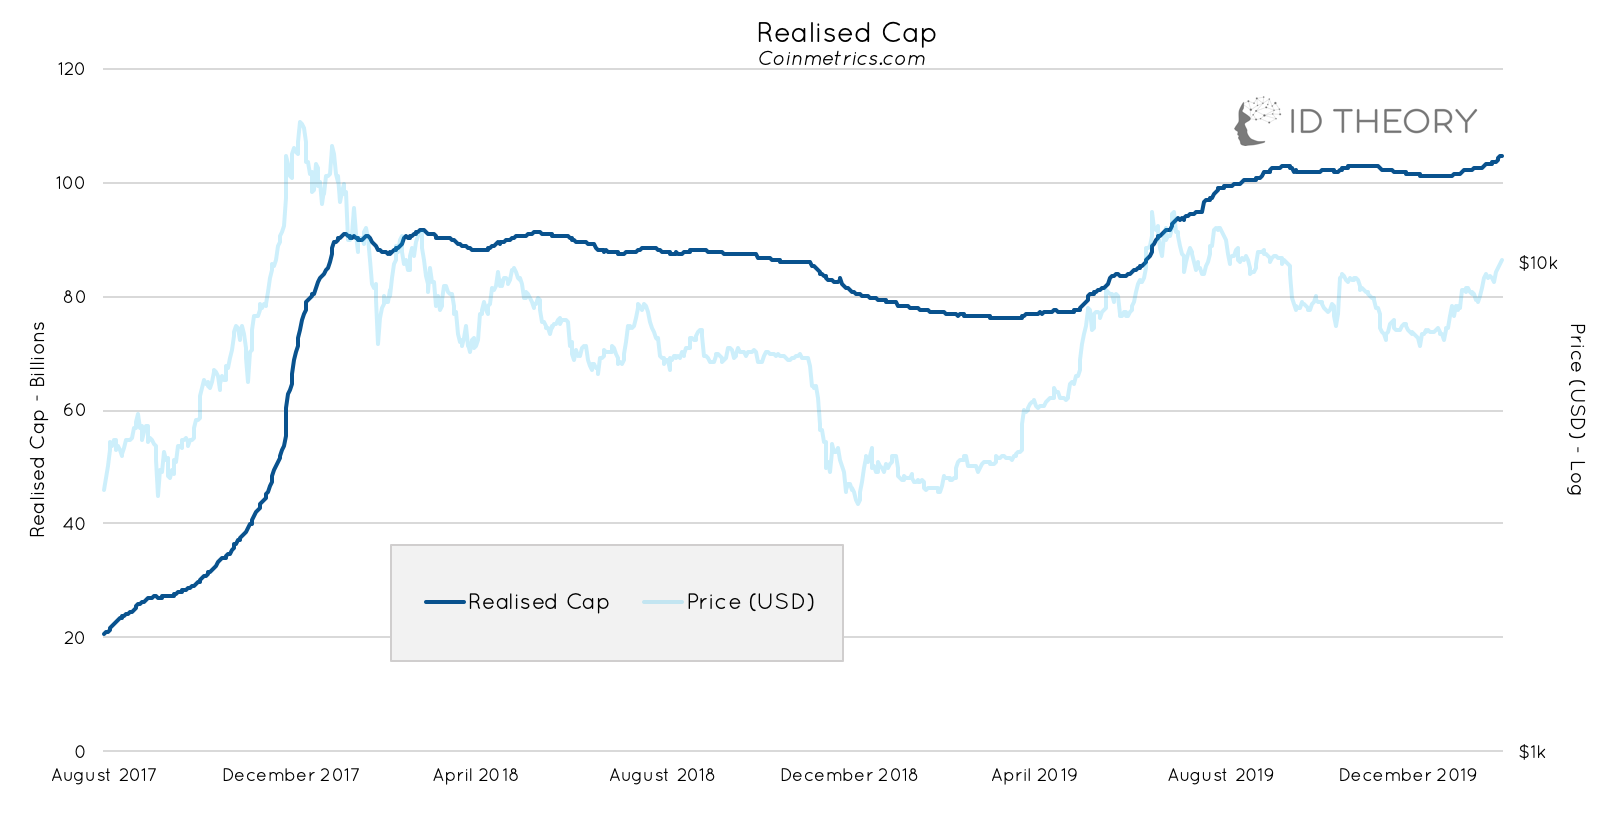
Realised Cap is at ATH with it currently standing at ~$104.6 Bn.
MVRV
Market Value/ Realised Value (MVRV) is simply the ratio comparing market cap and realised cap. When the MVRV is high then it might be an indication that the traded price might be above BTC’s ‘fair value’.
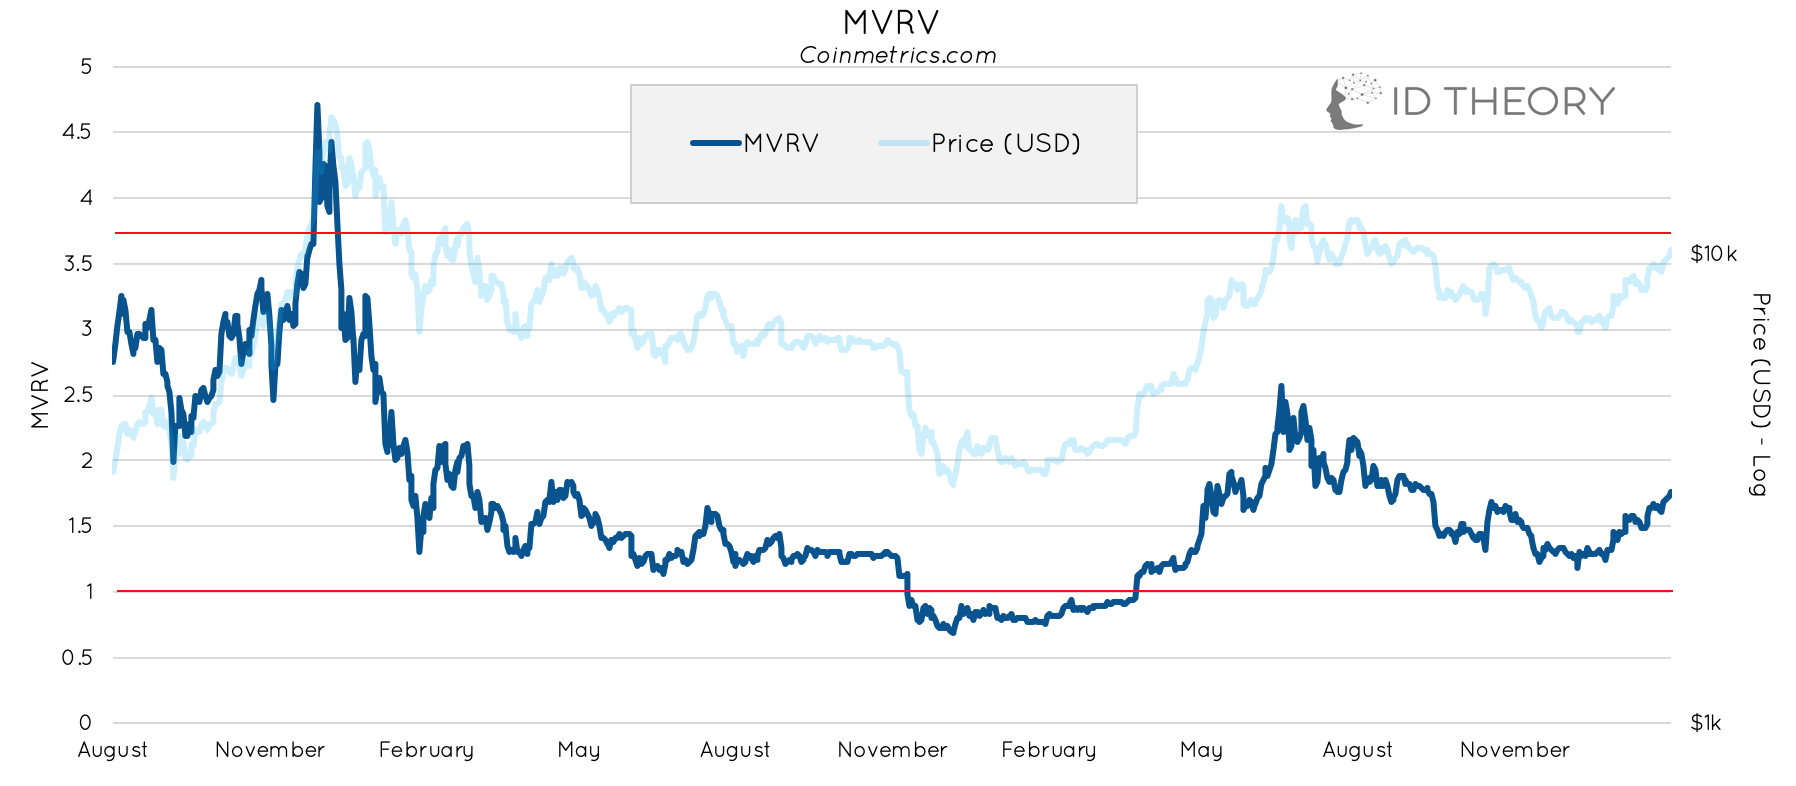
Historically, two important thresholds can be observed - MVRV above 3.7 could signal potential overvaluation and MVRV below 1 could signal undervaluation. The ratio ratio is currently at ~1.77.
Lightning Nodes
The Lightning Network is a "Layer 2" payment protocol that operates on top of Bitcoin). It enables fast transactions among participating nodes and has been touted as a solution to the Bitcoin scalability problem. An increasing number of nodes represents the growth and decentralisation of this network.

The number of unique lightning nodes on the Bitcoin network is up 1% for the week. The number of nodes is up 3% YTD.
Lightning Channels
Lighting channels enable users on the lighting network to send and receive money to and from other users. Once established they allow payments to stream seamlessly between two peers.

There are 28.6k unique channels on the lightning network, having increased slightly in the previous week (1%). The BTC capacity on the Lightning Network has decreased slightly by 1% (total capacity is ~865 BTC).
Wrapped BTC
Wrapped BTC represents bitcoin that has been locked in a smart contract to be deployed on Ethereum as an ERC20 token. This allows bitcoin holders to utilise the value of their bitcoin within the Ethereum ecosystem.
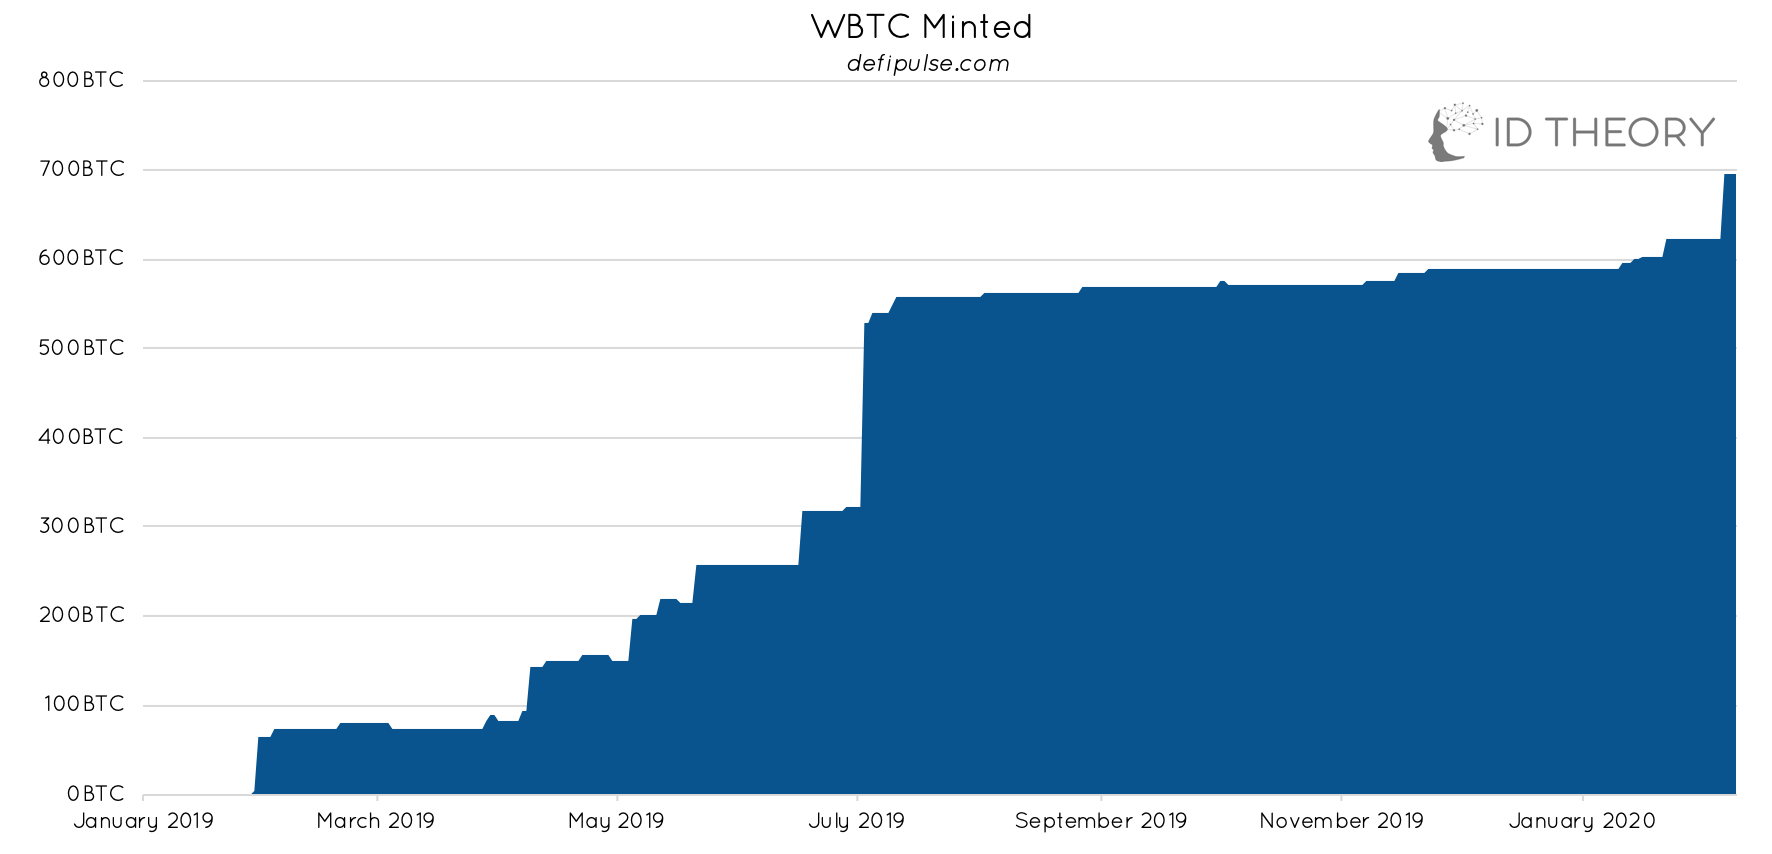
The total value of Wrapped BTC has climbed 12% in the past week (696 BTC).
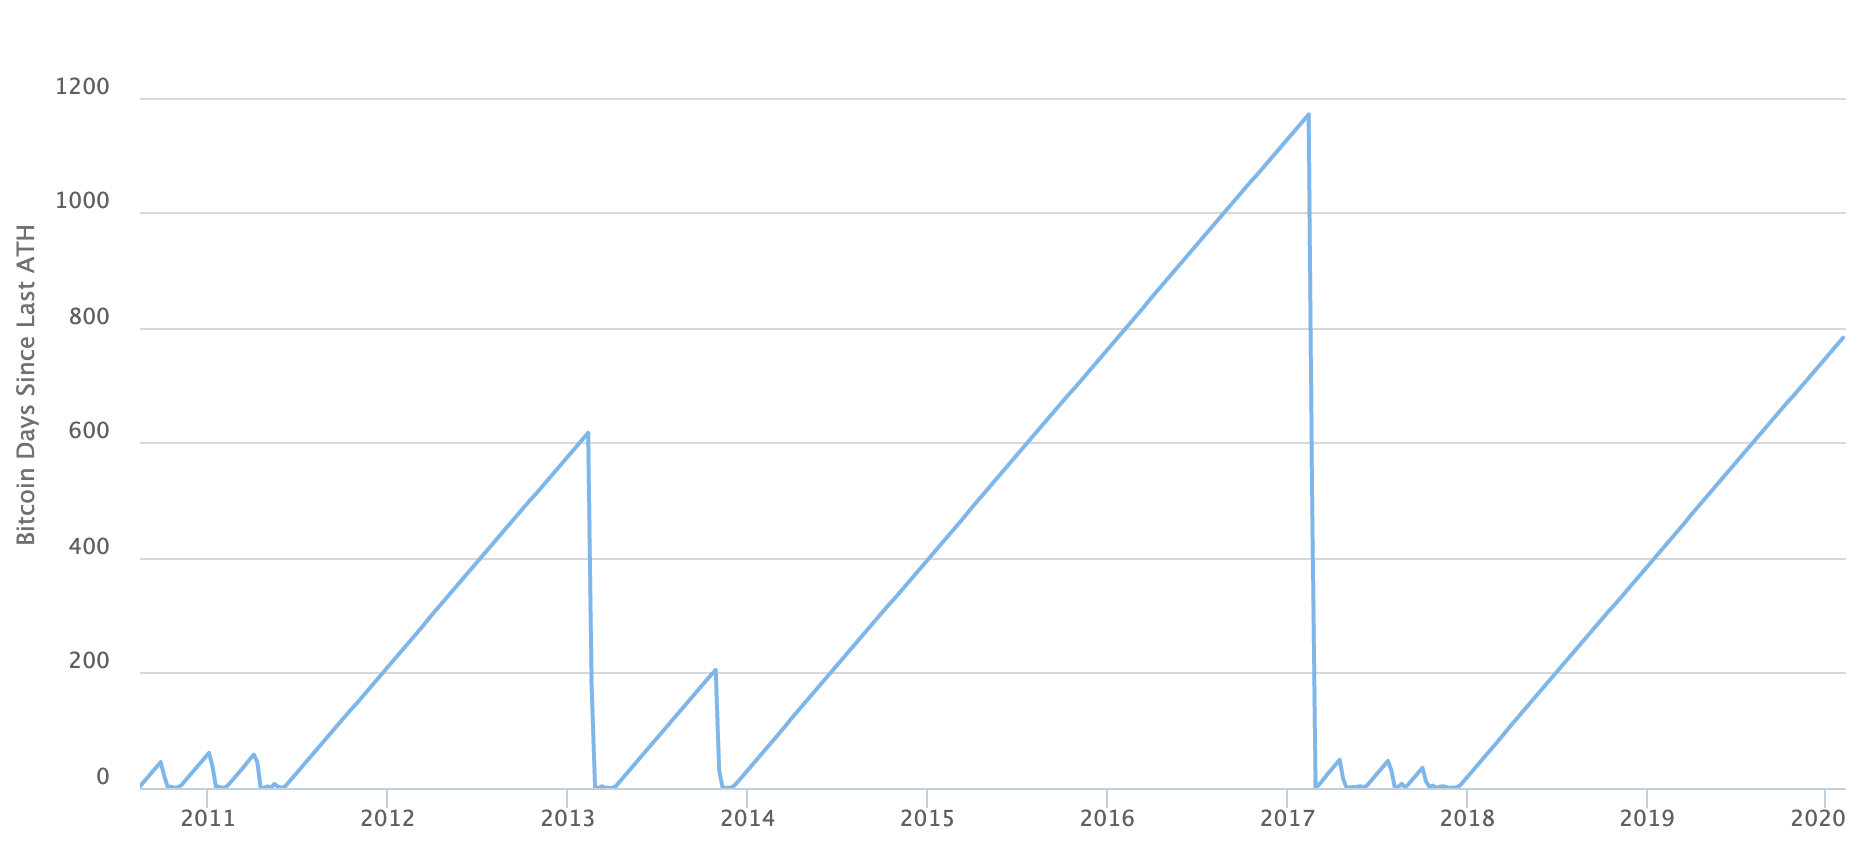
BTC Days Since All Time High
Tweet of the Week


Our ‘tweet of the week’ comes from Glassnode. The number of BTC addresses holding more than 1k BTC has reached a 3-month high. This signifies large traders or funds taking long positions in BTC in the last few weeks.

About the Author
Lewis Harland is an analyst at ID Theory and is a full time researcher of decentralised networks and cryptoassets.
ID Theory Ltd. is an Investment Advisor for cryptoasset investment fund, IDT Crypto Asset Fund Ltd.
Interested in partnering with ID Theory or building something special? Get in touch through our website or at info@idtheory.io.